Back to top: Introduction to tabulations
General
This section presents the data in a variety of tabular formats, sorted according to the most commonly used parameters. The quantity of information that is thereby immediately available to the user of the Urkesh Global Record (both the excavator in the field, on a daily basis, and then any interested scholar), is extensive and detailed, so as to allow an in depth assessment of the record on the basis of precisely quantified criteria.
The selection is made on the basis of predetermined criteria, whereby specific inquiry paths are set up and followed. Alternative paths are of course possible, and may be added as the need and opportunity arises. The current tabulations will serve as format models for such future updates to the UGR.
Back to top: Introduction to tabulations
Limits
No attempt is made at providing more complex elaborations, such as proper statistical analysis or simulations. For this reason I use the more neutral term “tabulations.”
Like any other text portion of the browser edition, these data can be selected, copied and pasted directly into programs such as Excel or Access. It must be noted, however, that elsewhere within the Urkesh Global Record (lower part of the right vertical bar) one will find a full Data Base, in formatted ASCII, that allows for an immediate importation of the data into specialized programs, commercial or otherwise, through which higher level analysis is possible without the need for extensive manipulation of the data.
Back to top: Introduction to tabulations
Nodes and atoms
It is especially in this section that one can appreciate in practice the emphasis I place (in the theoretical component of the Grammar) on the importance of gaining instant access from the higher nodes to the minutest bit of information. For instance, in the pottery frequencies one can look at the full details of every sherd or group of sherds that add up to very large category totals, some times numbering in the tens of thousand.
Since the tabulations are all produced automatically and instantly, on a daily basis during the excavations, they serve as a most useful tool for the ongoing confrontation with the vast mass of data that conditions our understanding of the stratigraphic reality.
Back to top: Introduction to tabulations
Indices and frequencies
Indices provide information sorted alphabeticclay by keyword. By clicking on any of these keywords, a complete list of links to all pertinent individual elements opens up in a second right hand bar on the screen. By clicking on the arrow at the top one can have an ascending or descending sorting order.
Frequencies provide the total number of occurrences for each entry, with simple percentages and bar-histograms for each entry. By clicking on the arrow at the top to the “Totals” column one can have a descending or ascending sort by quatity.
A review of these frequencies affords the support of a precise quantification for interpretive assumptions. While only higher level statistical analysis can properly support conclusive arguments, these frequencies support preliminary assessments on the part of the excavator. Indeed, the advantage of having these tallies immediately and regularly available during the excavation is clear. Without them, it is inevitable that excavators should rely on their own essentially selective memory in formulating impressionistic frequency assumptions that often condition the excavation strategy. The precise and verifiable quantification afforded by these computations, instead, allows the formulation of more explicit assumptions and a more clearly arguable strategy.
Back to top: Introduction to tabulations
Synoptic tables
A few categories have been selected to be displayed in a columnar format, such as definition, best image (photograph or drawing), locus, phase, stratum, ware or material and disposition. They are presented as columns for each of the major types of elements – aggregates and , items, q-items and sherds.
Note that in the case of multiple entries for the same category (e.g., where a feature is first defined as accumulation A, and then as accumulation D), only the latest entry (accumulation D) is retained.
Separate programs are used in the field but are not integrated in the Browser edition: they create more specialized tables, e.g., a list of items to be transmitted to the Museum, with the pertinent categories as required by the Museum.
Back to top: Introduction to tabulations
Correlations: spreadsheets
For more complex types of distribitial analysis, a special section of the database offers data organized in spreadsheet format, that can be processed with standard database management programs to obtain desired correlations.
Back to top: Introduction to tabulations
Correlations: interactive
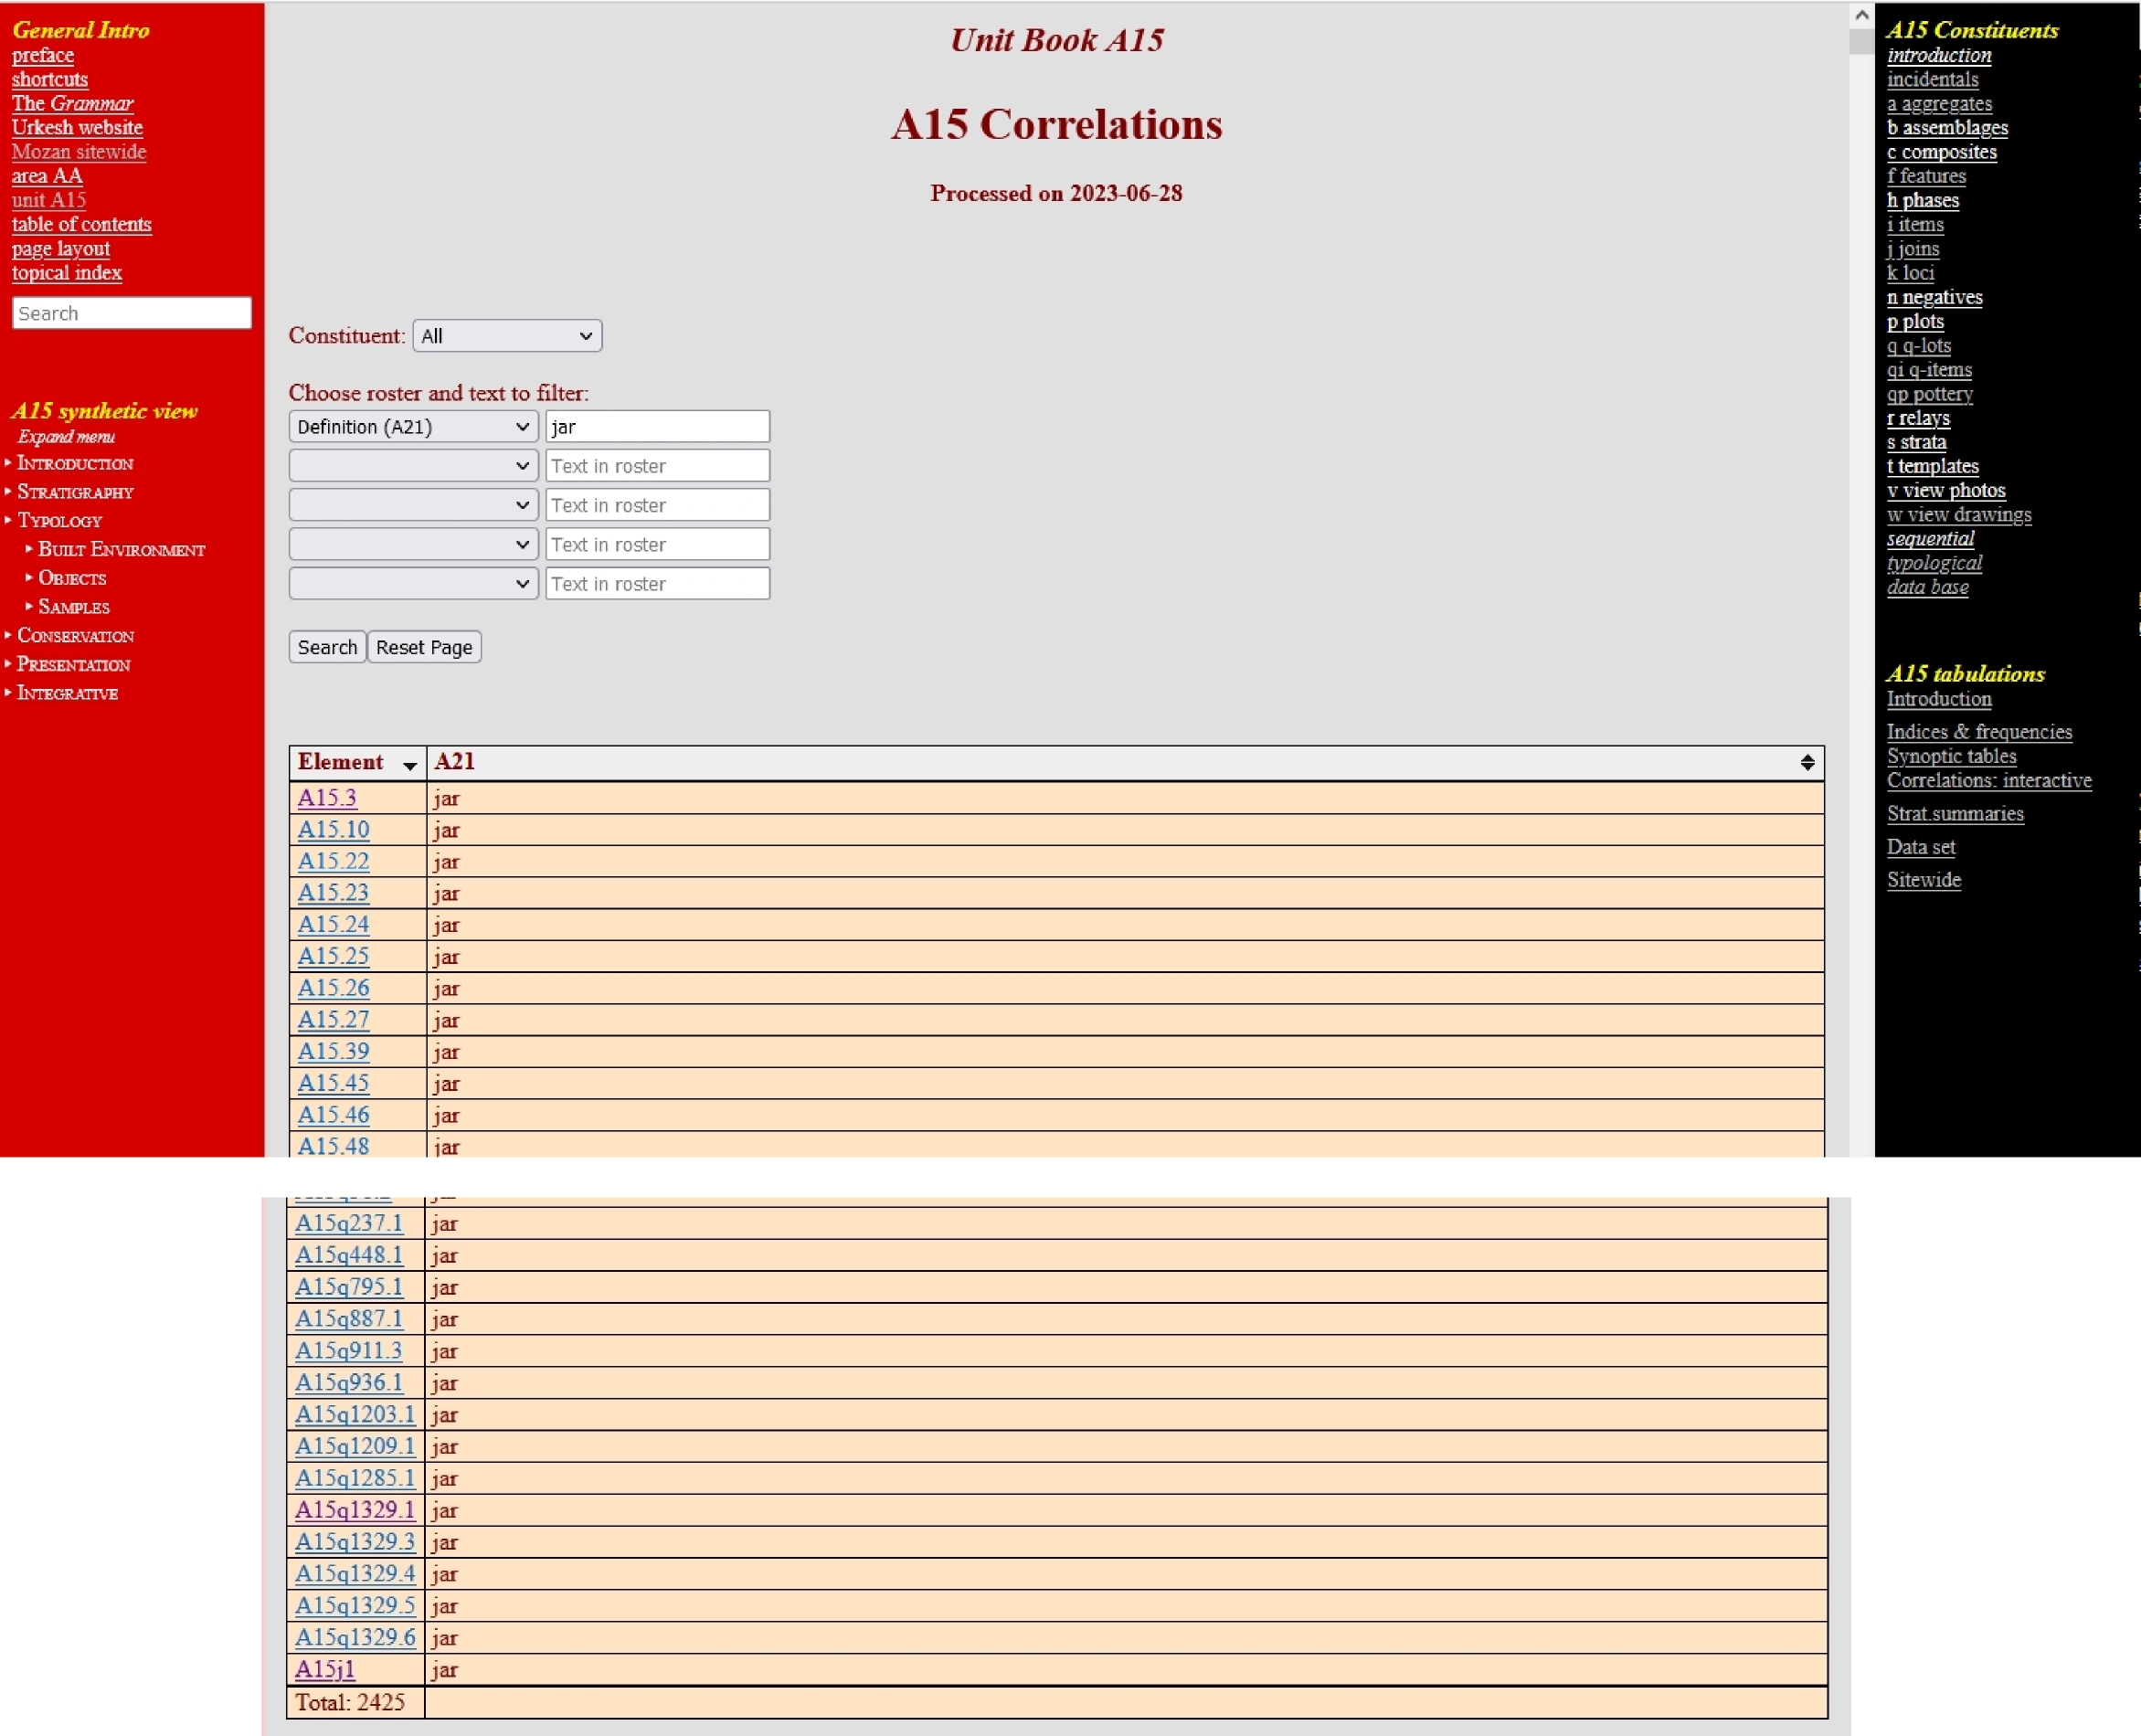
Interactive correlations provide simpler types of distributional analysis, and can be used as in the example to the right.
Clicking on the first cell, one gets a choice of possible roster slots: here we choose “Definition (A21).”
We then enter a desired definition, here “jar.” This selects all the jars in A15, for a total of 2425.
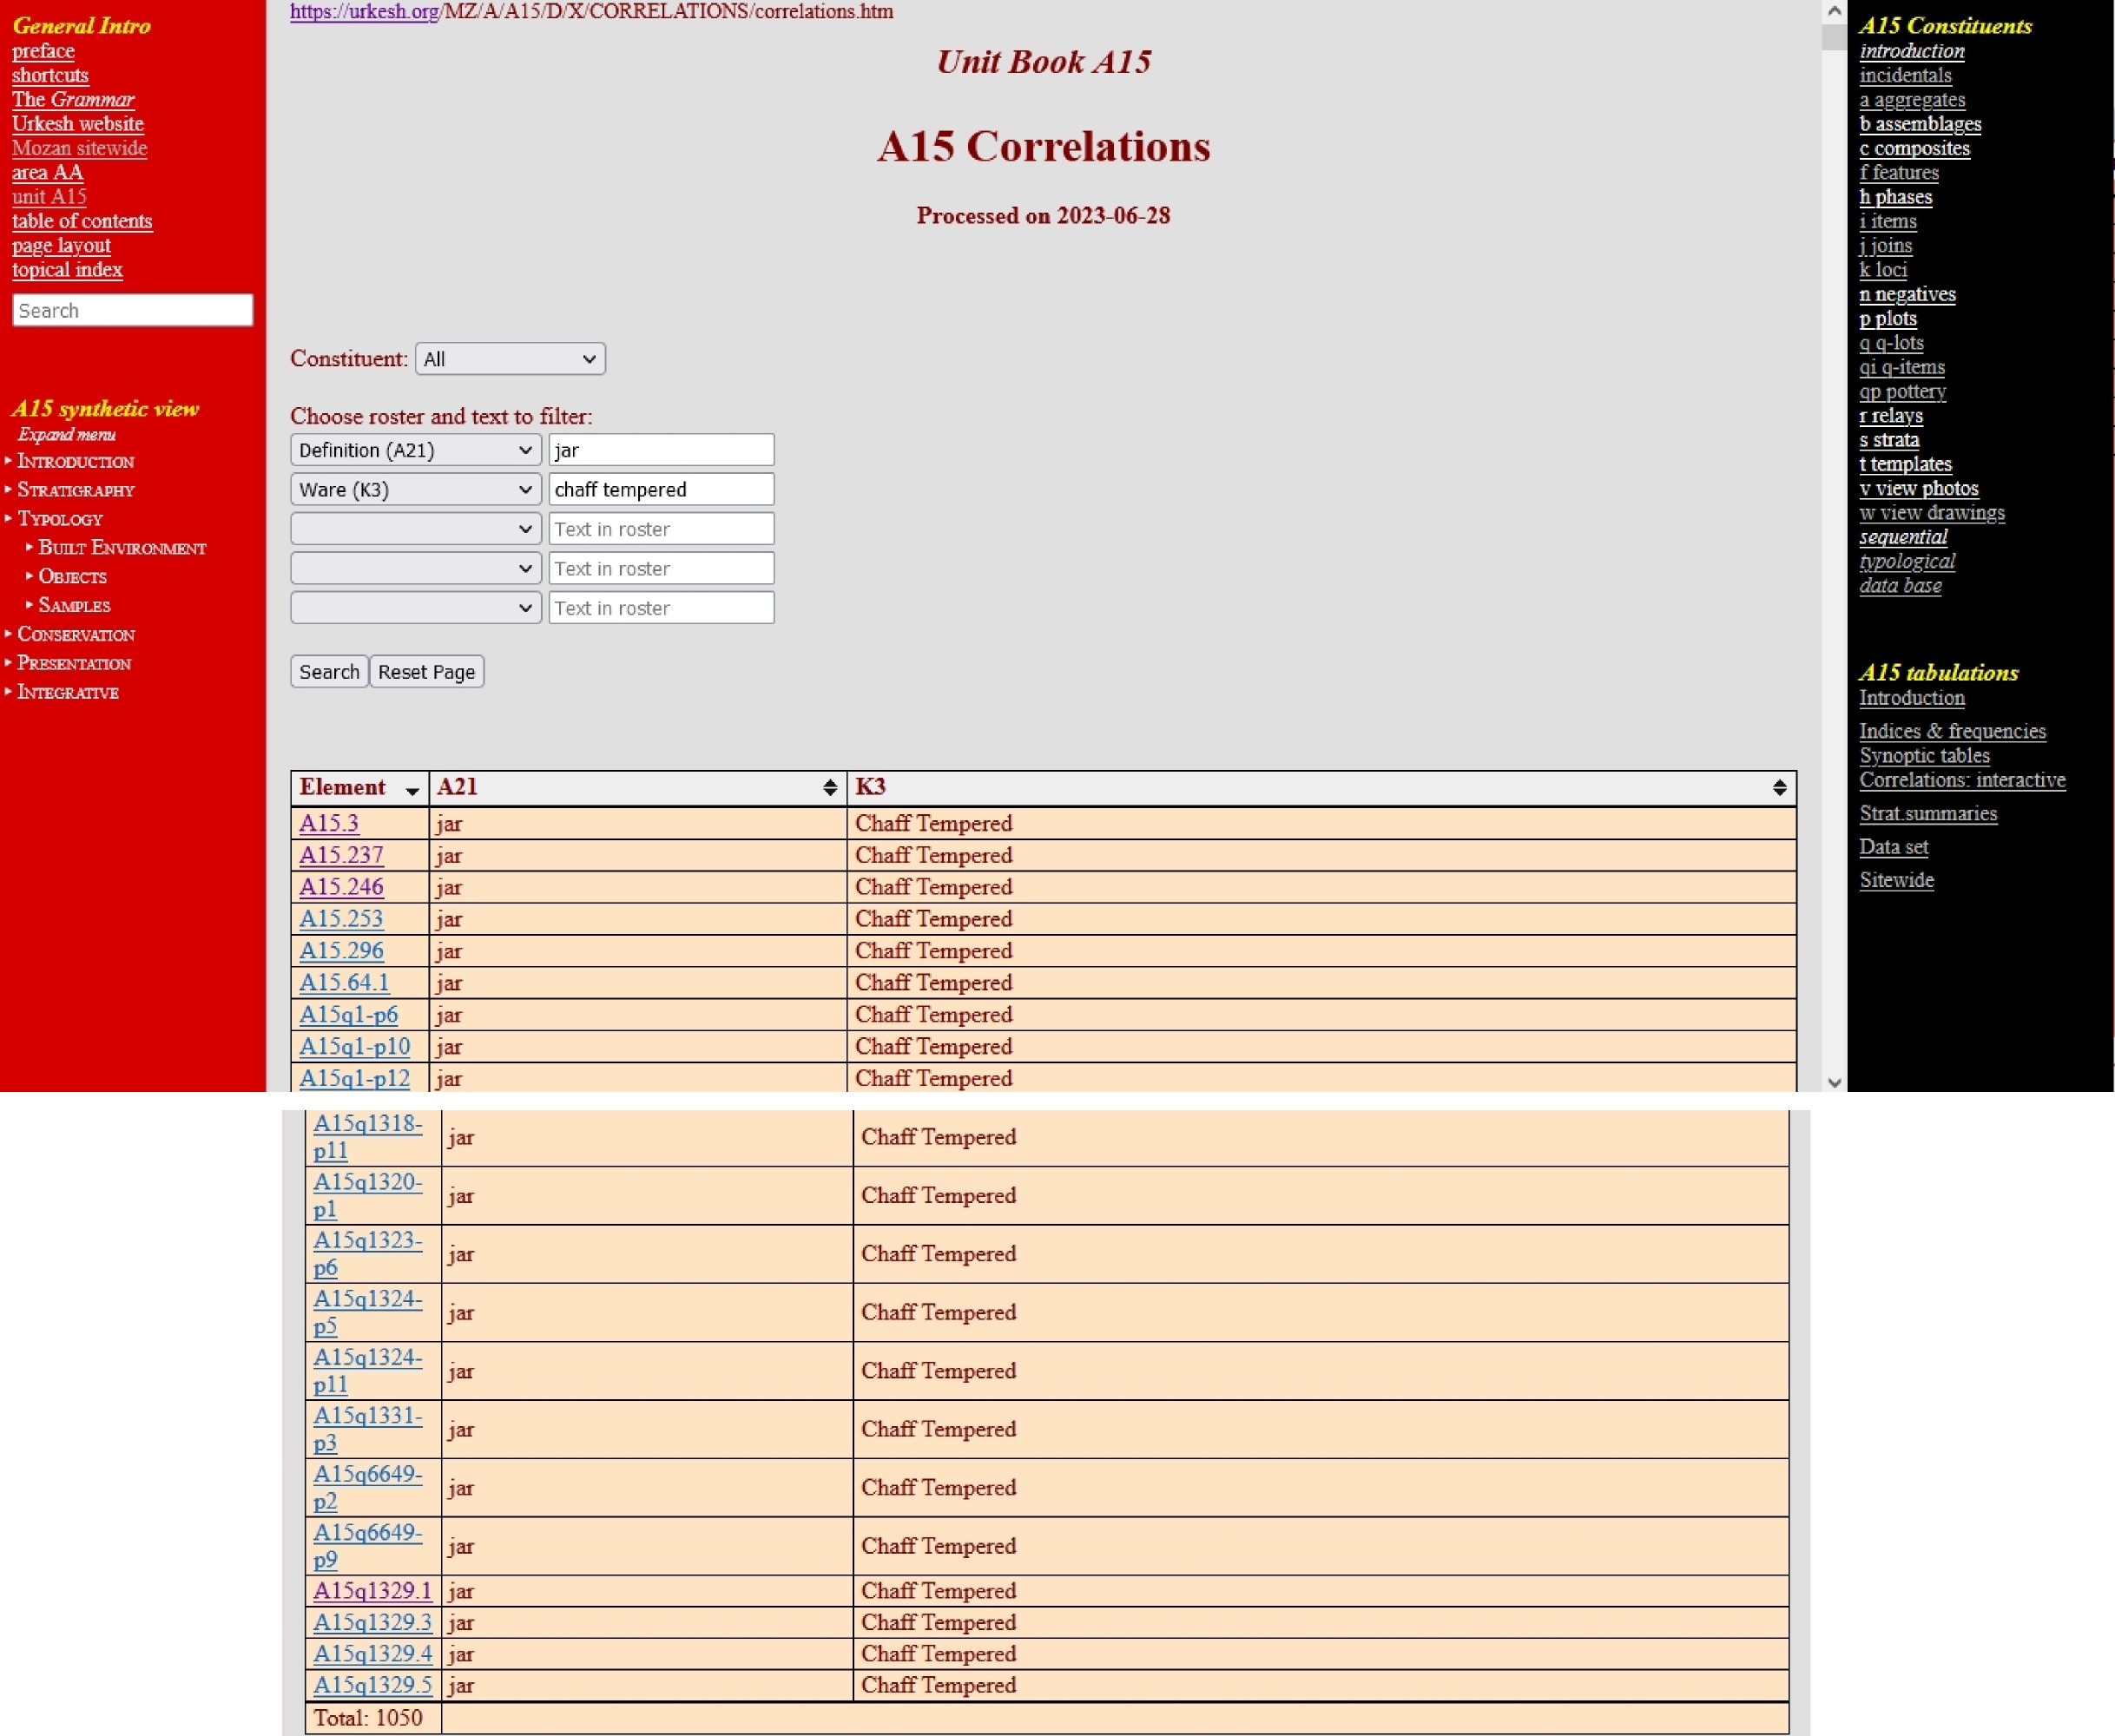
We then click on the second row, and select the roster slot “Ware (K3),” and we enter in the cell to the right the lexical definition “Chaff Tempered”.
This selects all the jars with this ware in A15, for a total of 1050.
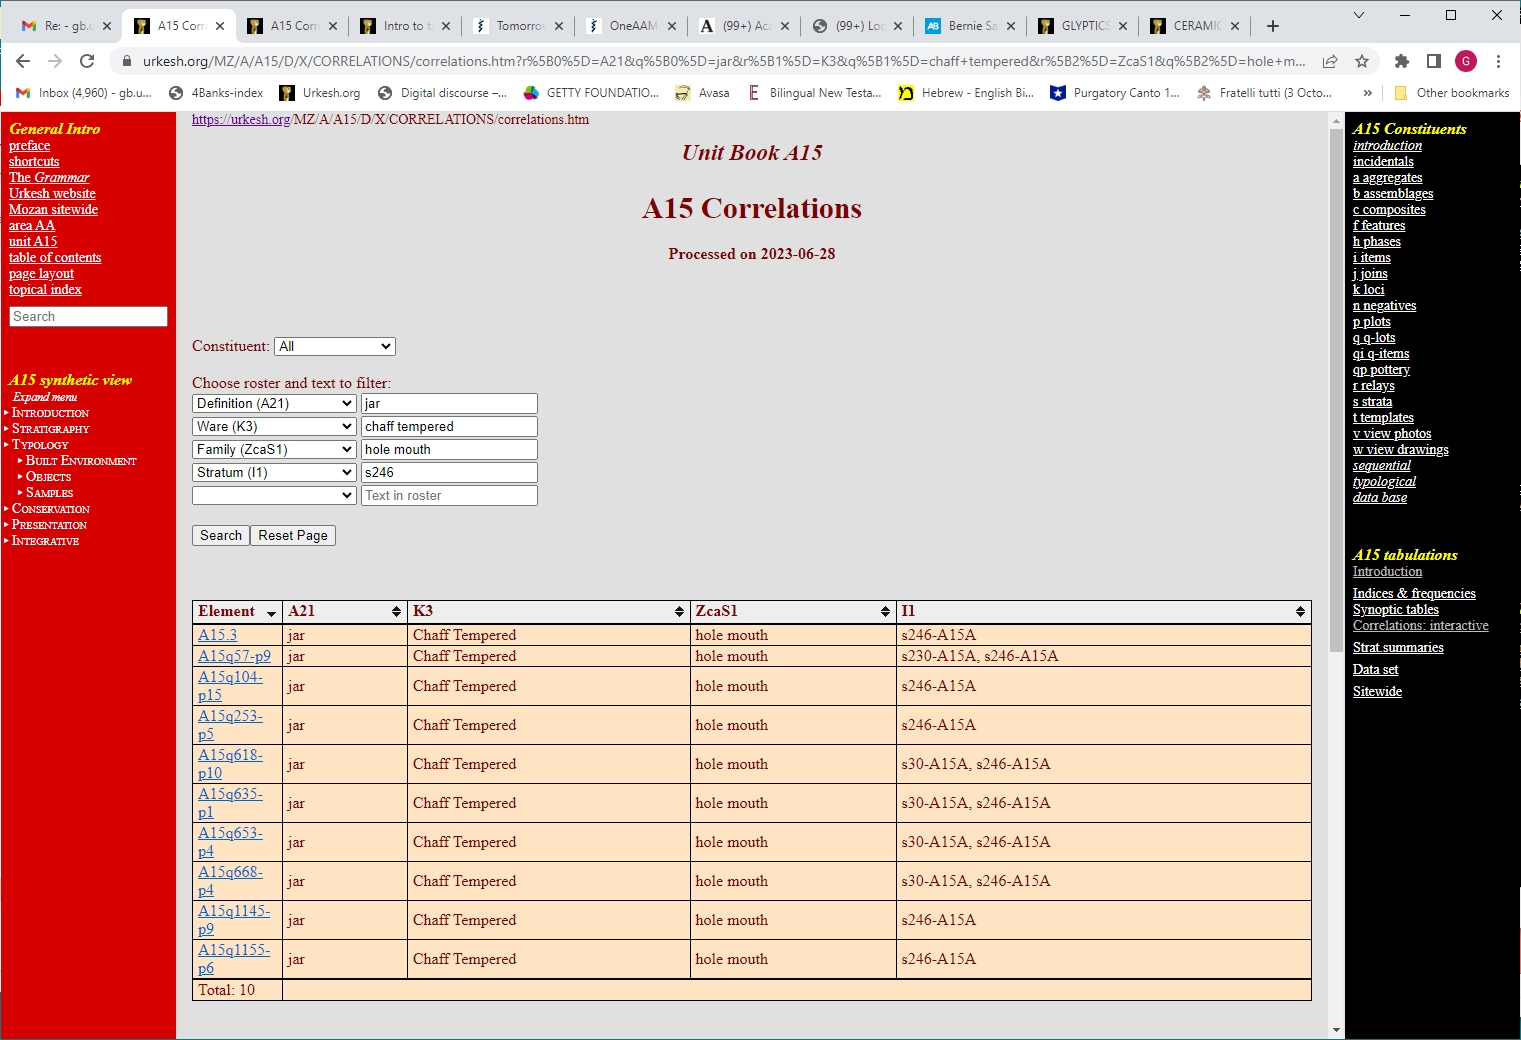
Clicking now on the third row, and selecting the roster slot “Stratum (I1),” we enter in the cell to the right the desired statum, s246.
This selects all the jars with this ware and this stratum in A15, now for a total of only 10.
Back to top: Introduction to tabulations
Ad hoc tabulations
As I have already stressed above, the preset tabulations given here are far from exhausting the possibilities of quantified analysis that is made possibile by the structured format of our data set. Some special tabulations that are produced for individual books are included in this section. They are produced on an individual books for special questions, such as ceramic ware group by phases renderd as a battleship histograms within the A16 book.
Back to top: Introduction to tabulations
Stratigraphic summaries
This section will present the flow of deposition within a given excavation unit. For more details, see a separate section.
Back to top: Introduction to tabulations
Data set
These tabulations provide an overall accounting of the files that comprise the entire data set for any particular book.
Back to top: Introduction to tabulations
Sitewide tabulations
Here one will fid a link to the sitewide tabulations given in the MZS digital book.
Back to top: Introduction to tabulations