Back to top: Colormod
COLORMOD Image Analysis
We used the COLORMOD program of modal color analysis on scanned sections of sherds, in order to identify and quantify inclusions and the firing spectrum of the ceramic body. The COLORMOD procedure and software was developed in 2002 by Roberto Cossio and Giacomo Chiari, both at the University of Turin at the time (Chiari later at the Getty Conservation Institute), with the potential of application to the study of pigments, petrography, and ceramics.Note 1 In an image, the program separates different chromatic areas based on the pixels’ color, which represent different components of the image (Chiari and Cossio 2004, fig. 7). Each cluster of pixels that fall within the same color range (that is, a separate component) is represented by a distinct set of Red-Green-Blue values and occupies a distinct position and serial number within a range of gray shades. Different color clusters are progressively identified, one at a time, resulting in a succession of pictures of the same original image until the entire visual field, or as much of it as meaningfully possible, has been broken down to its different color-coded components. The relative quantity of each component that has been chosen for color analysis is tabulated as a percentage of the total number of pixels in the image. In the case of scanned sherd sections, clusters of chromatically related pixels would represent various inclusions (mineral and organic) and/or other features of the ceramic body, such as pores and cracks, as well as different hues of the firing spectrum (Figure 1, Figure 2; Table 1, Table 2). Identification of mineral inclusions for analysis was based on the petrographic study of selected sherds (see below).
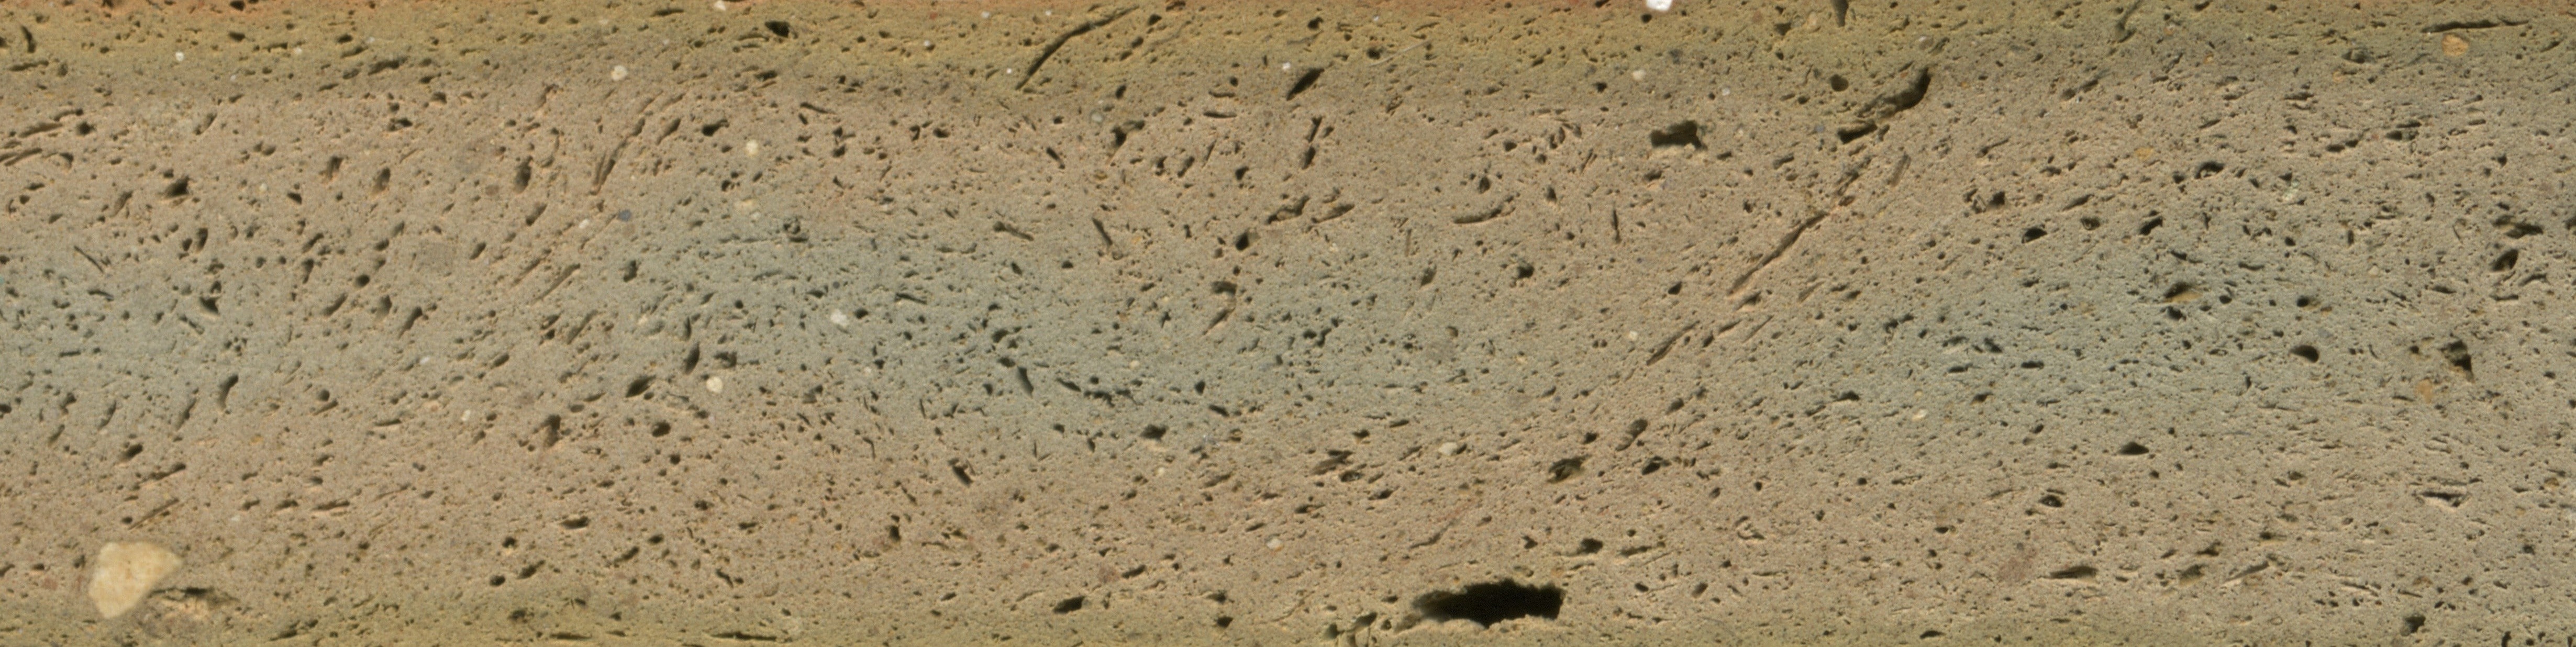
Fig. 1a |
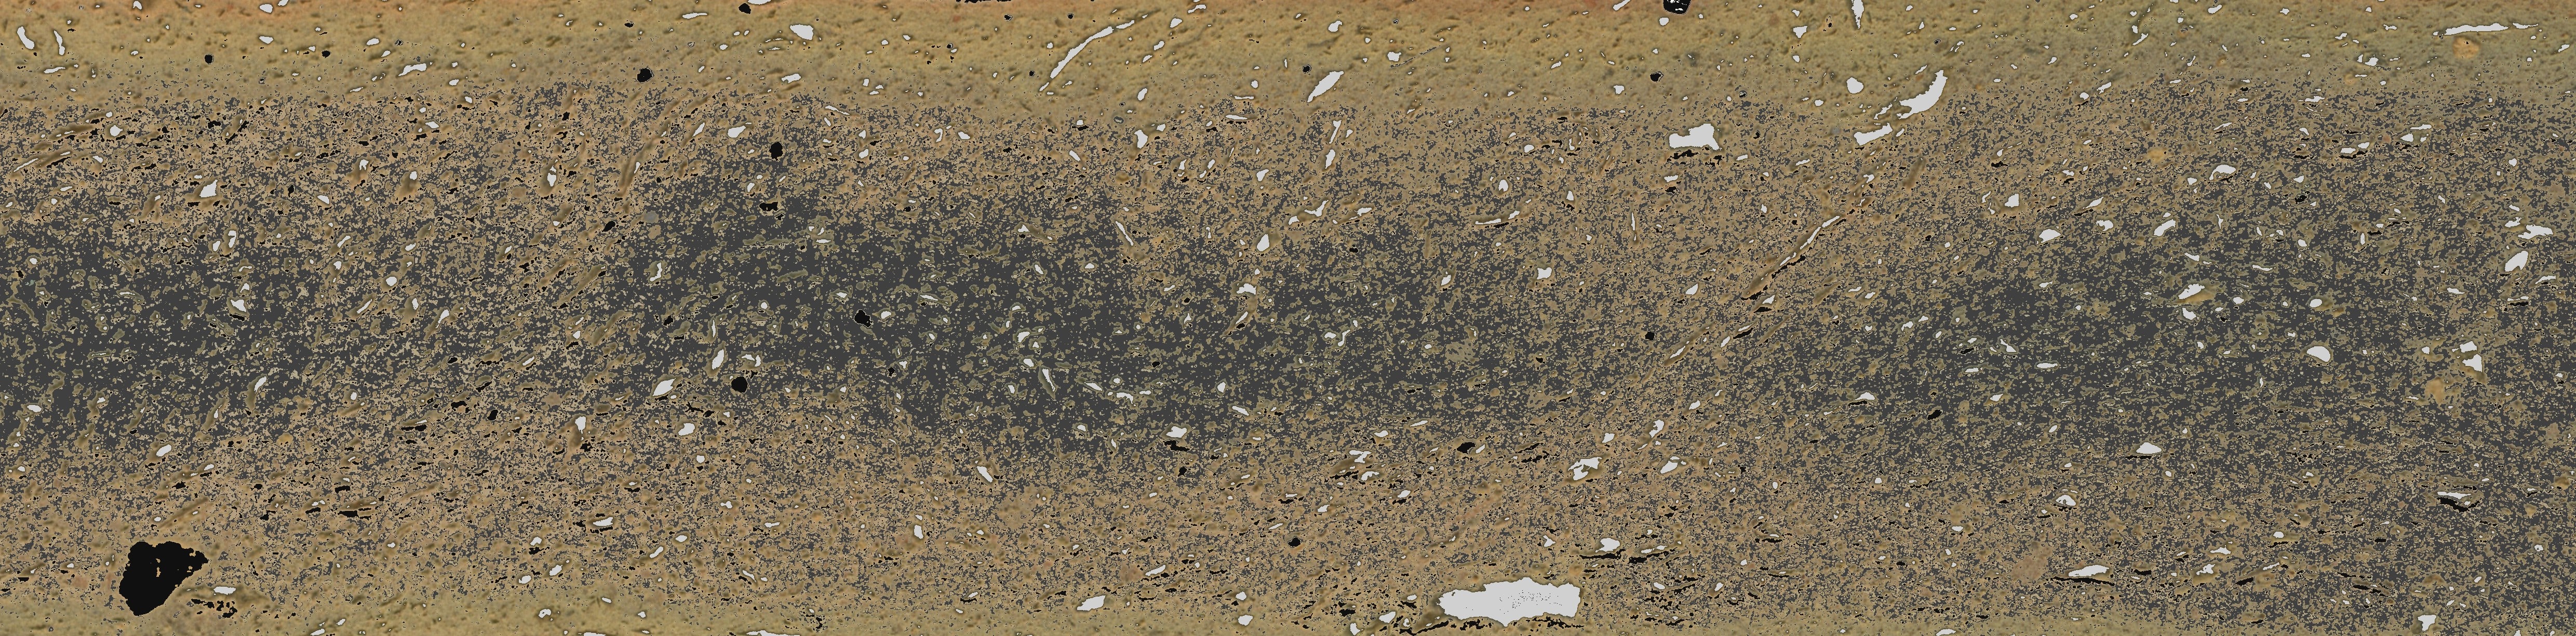
Fig. 1b |
Figure 1: Scanned section image (cropped) of a Chaff Temper bowl (A16q852p14f190, photo number V23q8533; Phase 5, 2000–1900 BCE), before (a) and after (b) COLORMOD analysis. |
| Name
|
%
|
Sigma
|
R
|
G
|
B
|
| calcite
|
02.56
|
00.01
|
184-255
|
161-248
|
107-238
|
| grey/core
|
31.35
|
00.02
|
134-172
|
129-165
|
110-137
|
| pore
|
02.34
|
00.01
|
007-082
|
007-072
|
000-047
|
|
|
------
|
|
|
|
|
| Sum
|
36.26
|
(of total image surface)
|
Tab. 1: MODAL RESULTS LIST A16q852p14f190, final COLORMOD image

Fig. 2a |

Fig. 2b |
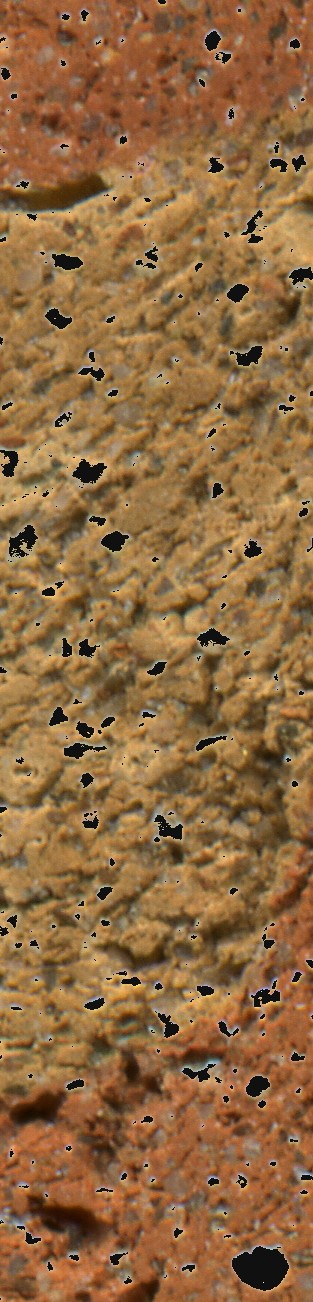
Fig. 2c |
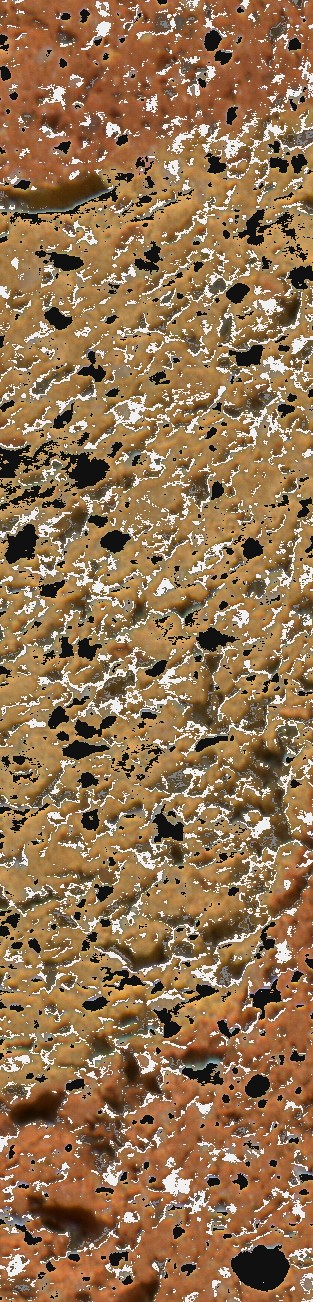
Fig. 2d |
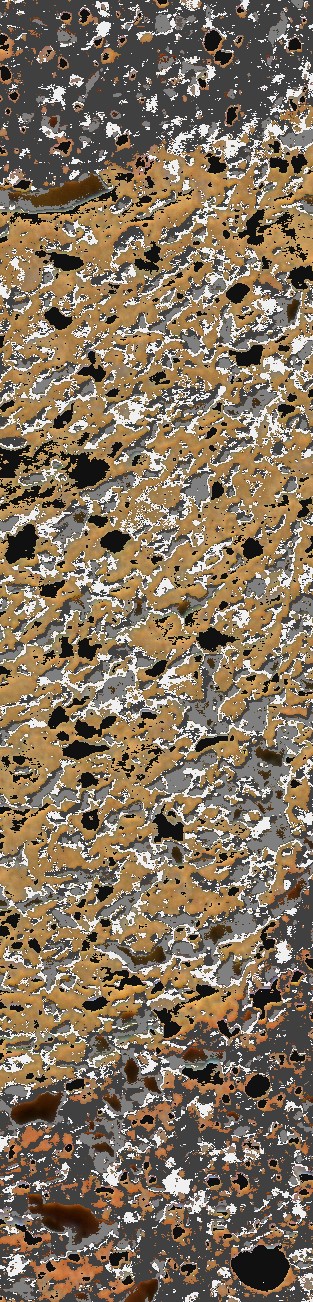
Fig. 2e |
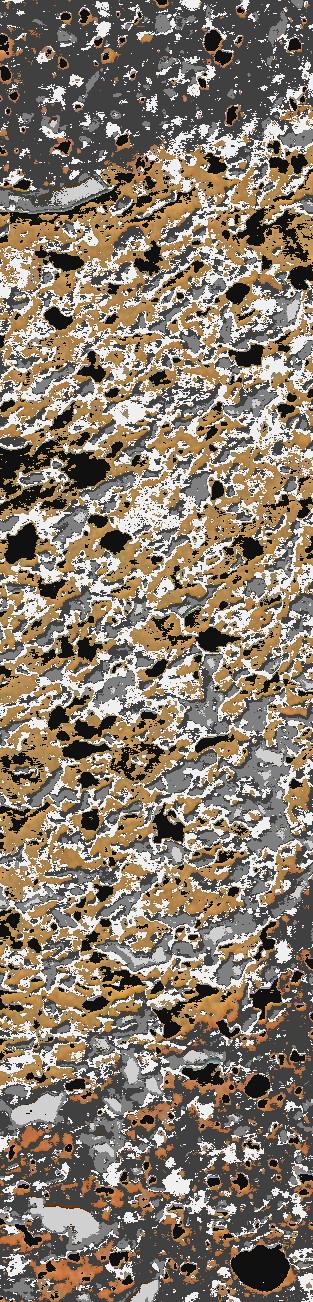
Fig. 2f |
Figure 2: Scanned rim section of a Khabur storage jar in Red Orange Calcite Temper ware (A15q792p5f399, photo number V20q15403; Phase 6a, ca. 1800 BCE), before (a and b [whole and cropped section, respectively]) and after (c–f) the successive stages of COLORMOD analysis. |
| Name
|
%
|
Sigma
|
R
|
G
|
B
|
| calcite
|
10.42
|
00.05
|
162-255
|
137-255
|
099-253
|
| red/wall
|
29.36
|
00.08
|
077-179
|
042-111
|
012-084
|
| quartz
|
08.75
|
00.05
|
069-110
|
033-087
|
021-065
|
| pore
|
01.79
|
00.02
|
025-083
|
011-054
|
000-043
|
| feldspar
|
13.21
|
00.06
|
108-159
|
084-115
|
056-097
|
|
|
------
|
|
|
|
|
| Sum
|
63.54
|
(of total image surface)
|
Tab. 2: MODAL RESULTS LIST A15q792p5f399, final COLORMOD image
Back to top: Colormod
Sampling and scanning procedures
Sampling strategies took into account multiple levels of variability in the ceramic corpus. A total of some 800 sherds were selected (the complete list is given in APPENDIX 3, representing: various contexts from sections of the palace, the temple area, and the residential area; distinct chrono-cultural horizons/phases, spanning the Late Chalcolithic (Urkesh Phase 2, 4th mill.) to the Mittani period (Urkesh Phase 7, second half of 2nd mill.; see MZA); all major wares, ranging from fine to heavily tempered utilitarian; and different vessel parts (rims, body fragments, bases); see “Shapes by horizons” and “Categorization”; cf. Figure 3.
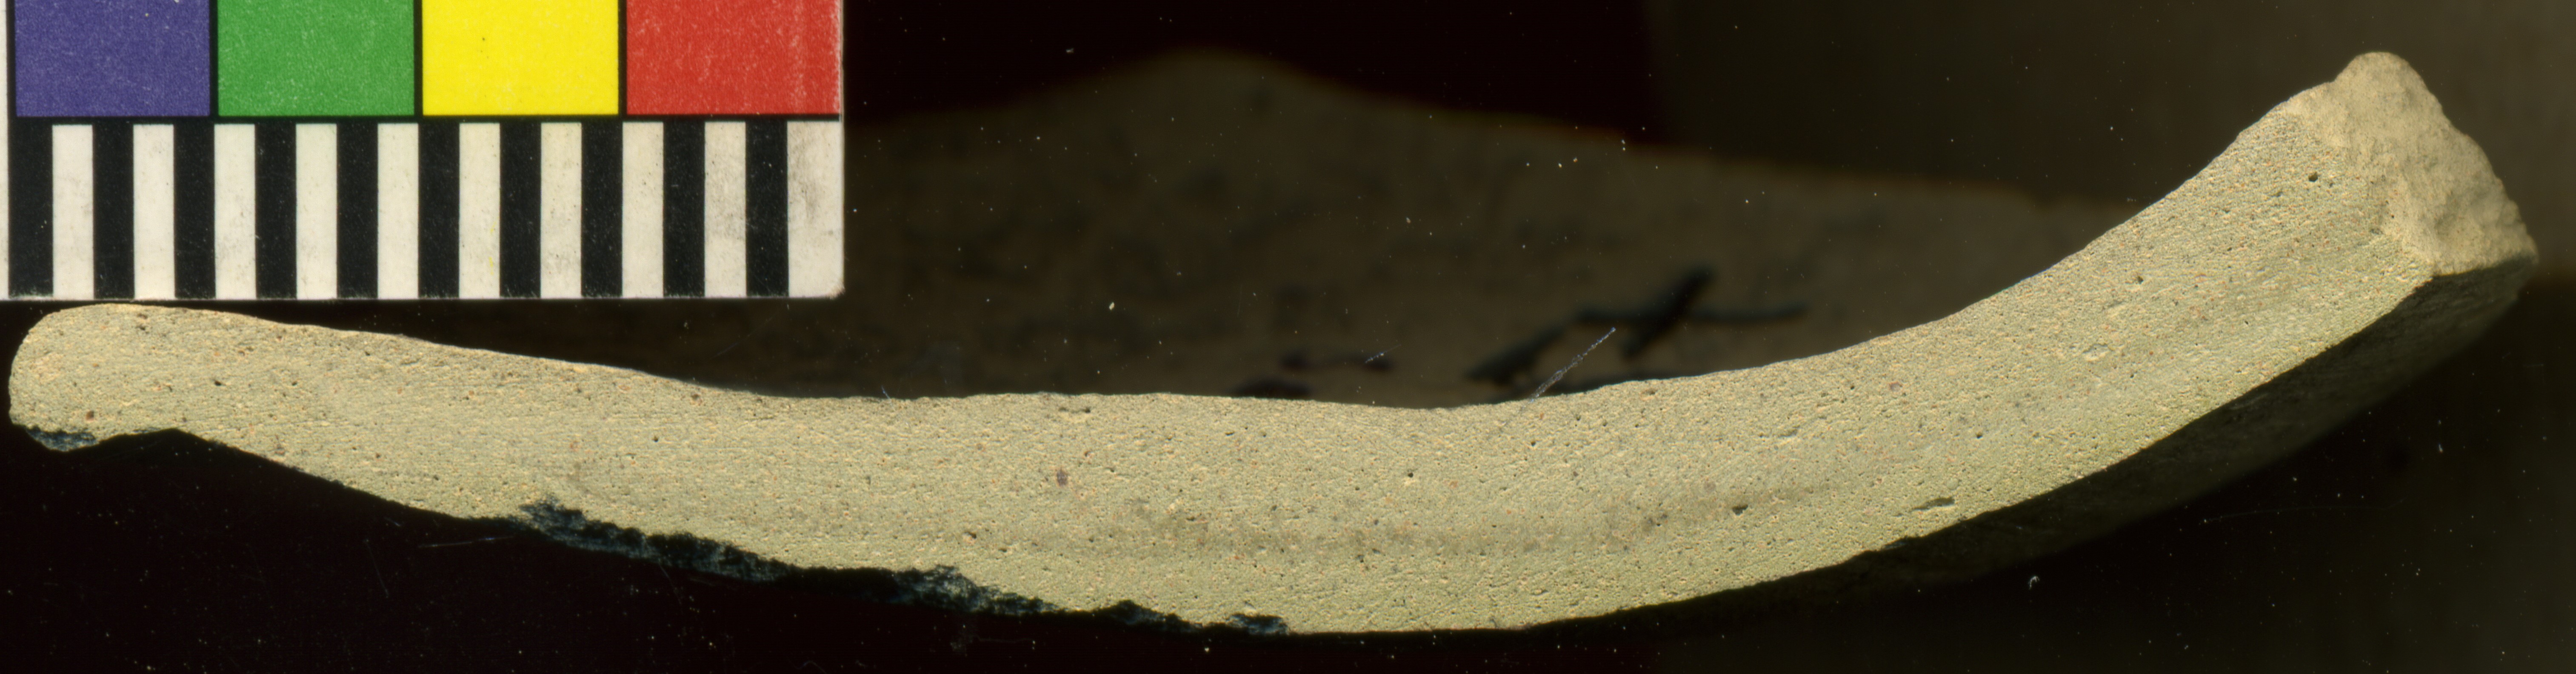
Fig. 3a |

Fig. 3b |
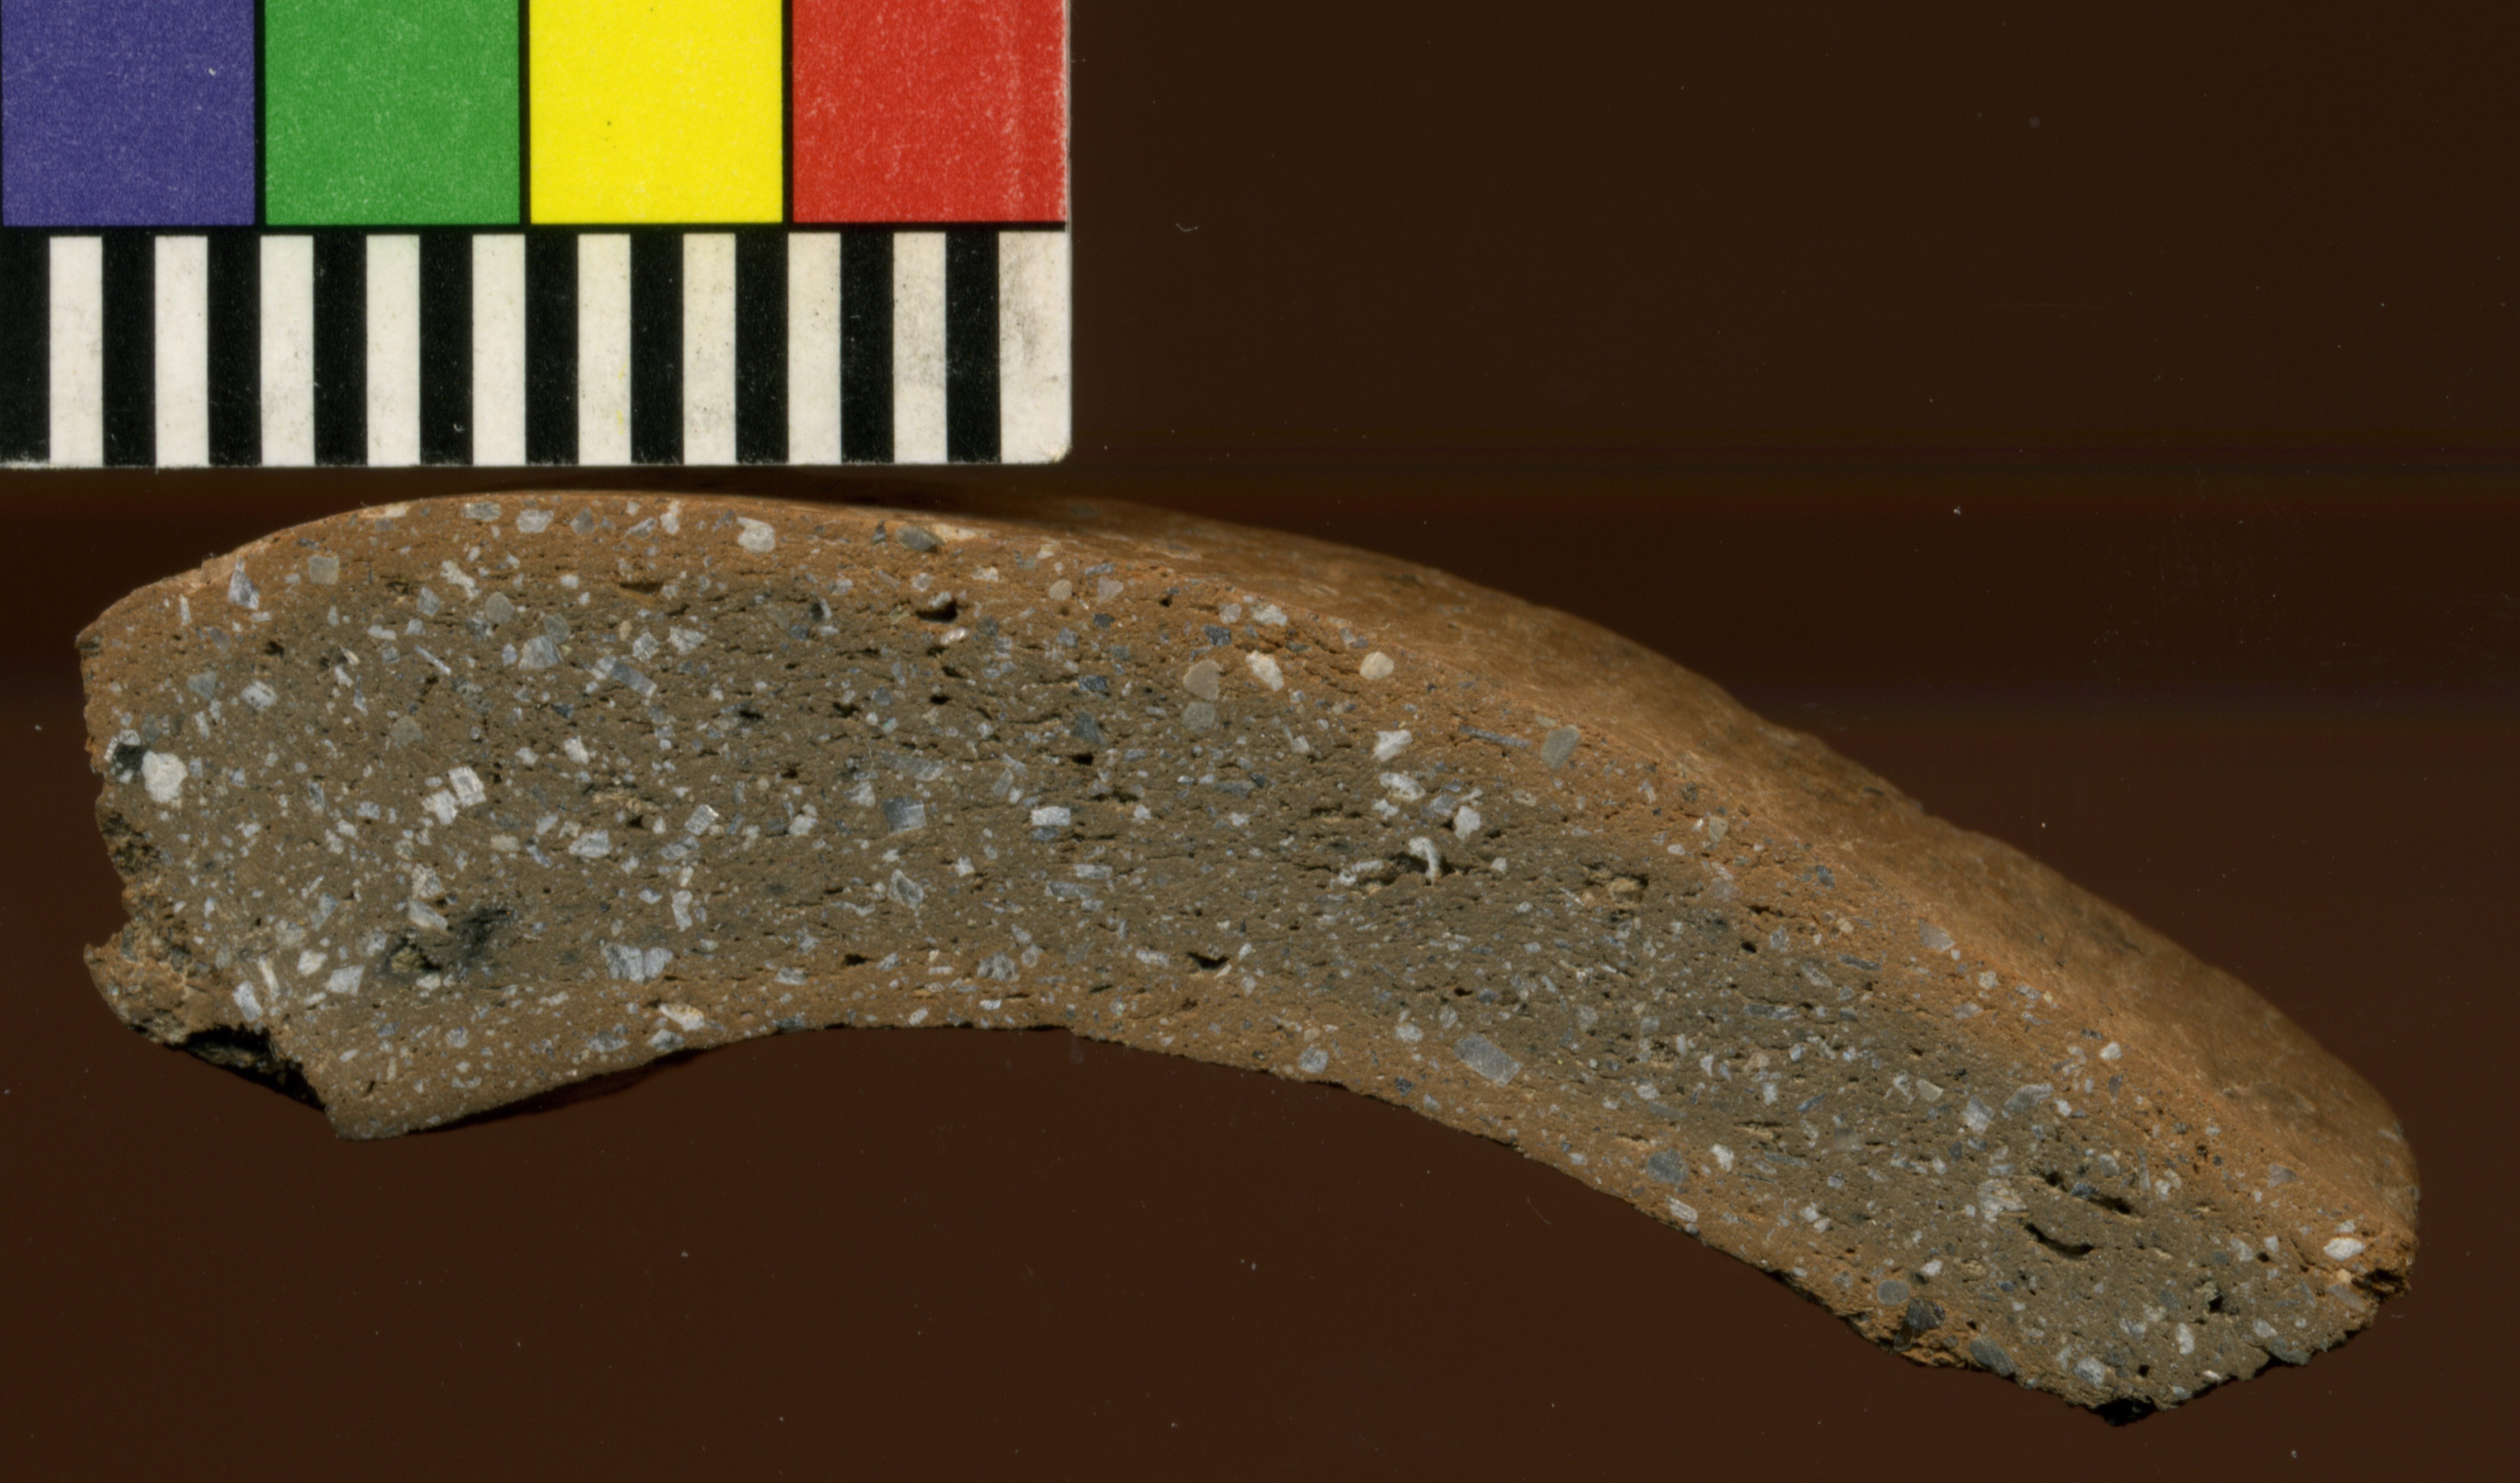
Fig. 3c |
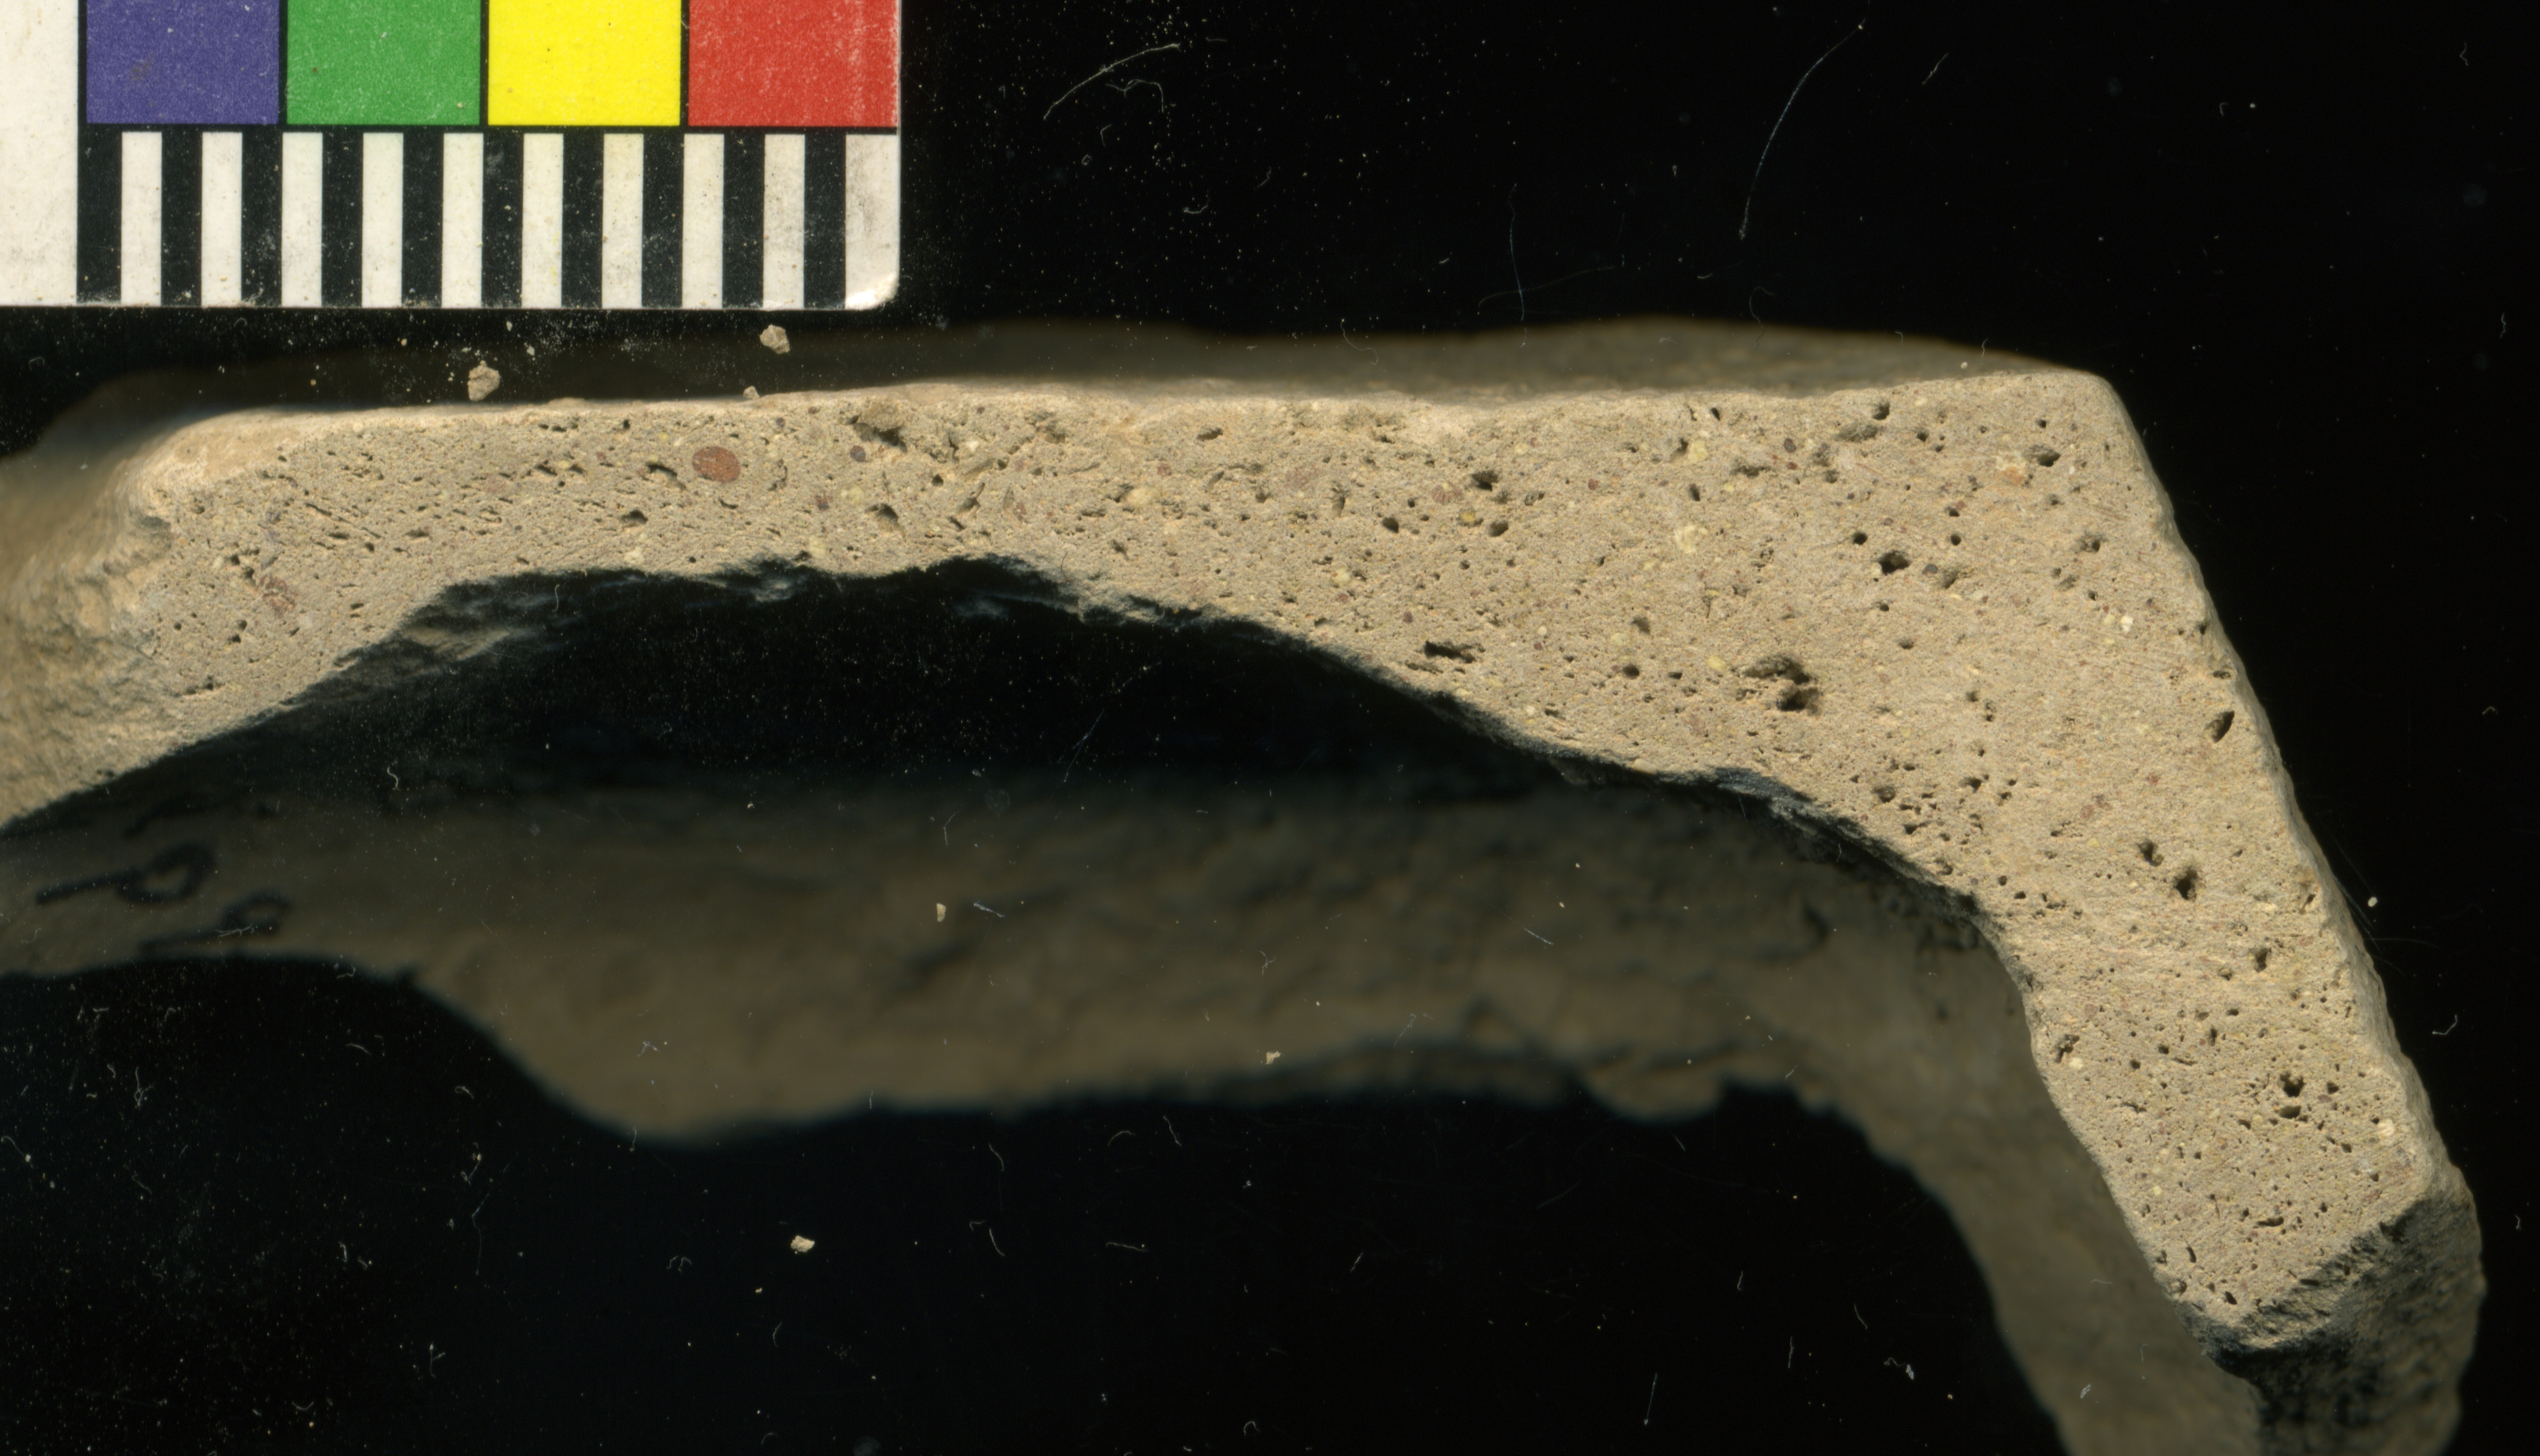
Fig. 3d |
Figure 3: Examples of four distinctive wares sampled for COLORMOD analysis: (a) Wet Smooth bowl from the Temple area: B5q900p52f55+, photo # V20q1317 (Phase 3); (b) Chaff Temper necked jar from the palace area: A7q1064p8f399, photo # V20q1204 (Phase 4); (c) Fine Pebble Temper cooking vessel from the paved palace court: A16q797p23f302, photo # V22q1605 (Phase 5, above the Tupkish palace); (d) Fine Calcite Temper vessel from the lower sacral area: A14q552p9f234, photo # V22q2512 (Phase 5). |
Back to top: Colormod
Cutting
The sherds were cut onsite using a circular saw (a LEZACO marble cutter with a 110-mm carbide disc) purchased in Syria. The cut surfaces were polished using a sequence of three sandpaper grades (80, 150, and 220 grit) to remove the saw marks. The sherds were then washed carefully so that no residue or debris remained, and left to dry. The polished surfaces of the sections were scanned at a high resolution (2400 dpi; 0.01 mm/pixel), using a flatbed photograph scanner and a computer in the fieldhouse. The scanned images were cropped to an appropriately-sized and clear portion of the ceramic body (without visual distractions such as the sherd edges or background space), which could then be subjected to color analysis.
A key advantage of this method is that we could process most sherds locally, without having to export them out of the country. The process was fast and low-cost, and the equipment was easy to transport and maintain. Rims and body or body/base fragments were sectioned vertically, from the top down; bases were cut horizontally, across the base. We kept and recorded both sectioned parts. In the early years (2003–2006) the sectioned sherds were exported to UCLA for scanning and study, but this was becoming complicated due to the large numbers of sherds. Therefore, in 2007 we scanned the sections, kept the larger sectioned part in the ceramics reference library onsite, and reserved the smaller parts to export for special studies (petrographic examination, residue analysis, and so forth).Note 2 Back at UCLA, the database of scanned images was fully integrated into the Urkesh Global Record.Note 3
Back to top: Colormod
Images Analysis: A Metodological Experiment
A pilot group of 19 sherds was analyzed with the COLORMOD software in 2007–2009. We focused on the Chaff Temper (CH) and Red Orange Calcite Temper (RC) wares. These two fabric categories are especially interesting in terms of the variety of inclusions and the building and firing profile of the clay body; in addition, they have a very long life and an abundant presence on the site (see “Shapes by Horizon “, “Categorization/Chaff Tempered Ware” and “Red Oragnge Calcite Tempered Ware”). For these reasons they lend themselves particularly well to analysis along the parameters set out in this study. We chose material dating to Phase 5 (urban contraction / Ur III /Isin Larsa, 2000–1900 BCE) and Phase 6 (provincial status / Khabur,1800–1600 BCE; see MZA). The material came from three key units in the area of the palace, which also produced post-Akkadian features and material (see MZS/AA: Palace Area):Note 4
Unit A16 (paved court [SW]): Phase 5
CH: A16q852p14f190, A16q899p8f289
RC: A16q852p8f190, A16q901p2f289
Unit A14 (lower sacral area): Phase 5
CH: A14q460p10f193, A14q573p1f242
RC: A14q430p1f181, A14q460p2f193, A14q460p7f193, A14q464p2f196, A14q469p6f193, A14q548p11f234, A14q550p5f234, A14q550p6f234, A14q685p12f260, A14q692p11f223, A14q697p16f223
Unit A15 (reception area): Phase 6
CH: A15q858p5f399
RC: A15q792p5f399, A15q864p4f430
Back to top: Colormod
Illustrated catalog
An illustrated catalogue of this group can be found in Appendices 1a (CH) and 1b (RC). The inferred shapes (based on comparanda in the Urkesh corpus) include deep bowls, carinated bowls, and jars meant for the storage of dry goods (see Kelly-Buccellati 2019). This pilot analysis was intended to test whether we could detect any measurable variables that might correspond to the phase-specific features of shape and ware, and/or the related changes over time, which have been observed macroscopically for these two successive periods (see “Shapes by Horizon/Ur III/Isin Larsa” and “Khabur/Provincial Status”). Ultimately, we were looking for quantifiable insights into the potters’ technological choices and praxis.
The results of the COLORMOD analysis confirmed the strength of the program in its ability to illustrate, both visually and numerically, the composition of ceramic fabrics, including mineral non-plastics (temper materials or natural inclusions of the clay), pores left by organic material, and firing effects as reflected in color variation of the ceramic paste or in cracks that possibly resulted from thermal stress Figure 1, Figure 2, Figure 4. In addition to the analytical capability of the COLORMOD itself, the high-resolution quality of the scanned section images further enabled the examination of the fabrics, resulting in interesting observations and implications for interpretation along the dimensions of both phase and ware.
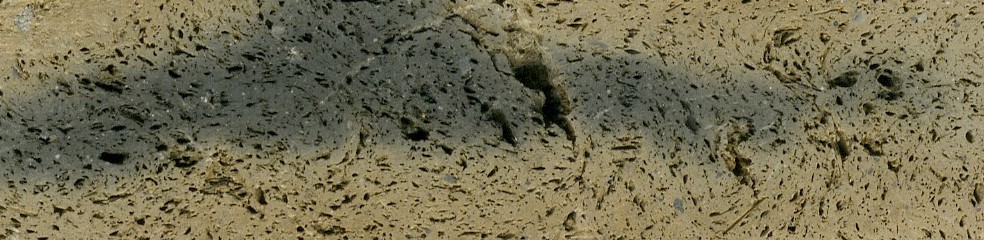
Fig. 4a-1 |
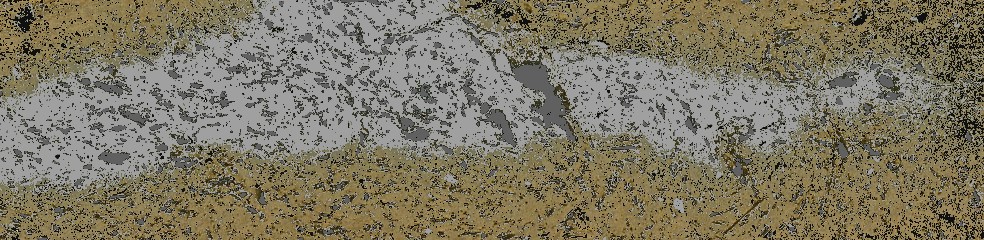
Fig. 4a-2 |
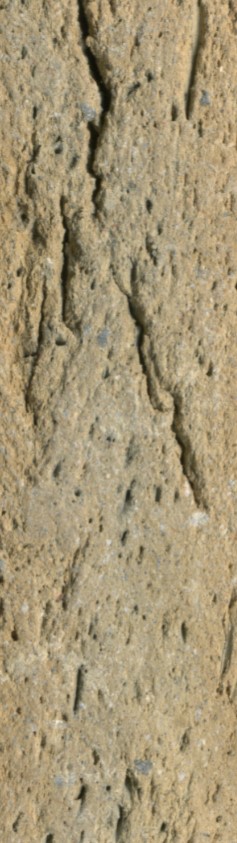
Fig. 4b-1 |

Fig. 4b-2 |
Figure 4: Scanned section images (cropped) of a Chaff Temper storage jar with extensive dark core (a), and a Red Orange Calcite Temper base with fire-induced cracks (b); both of Phase 5. (a) A14q573p1f242, photo number V22q1420; (b) A14q550p6f234, photo number V22q141. Images taken before and after COLORMOD analysis. The modal results can be found in Appendices 1a and 1b, respectively; the results for vessel (a) are also given below. |
| Name
|
%
|
Sigma
|
R
|
G
|
B
|
| calcite
|
06.22
|
00.05
|
103-206
|
109-187
|
099-166
|
| pore
|
07.16
|
00.06
|
000-038
|
002-041
|
000-032
|
| gray/core
|
34.39
|
00.12
|
050-112
|
056-110
|
042-087
|
|
|
------
|
|
|
|
|
| Sum
|
47.77
|
(of total image surface)
|
MODAL RESULTS LIST A14q573p1f242, final COLORMOD image
Back to top: Colormod
Fabrics Distinction
In this way we could refine the distinctions between contemporary fabrics in Chaff Temper and Red Orange Calcite Temper wares (Figure 5). In some cases, this led to the reclassification of a vessel to a different ware category than the one to which it had originally been assigned macroscopically (for example, Figure 5b).

Fig. 5a-1 |
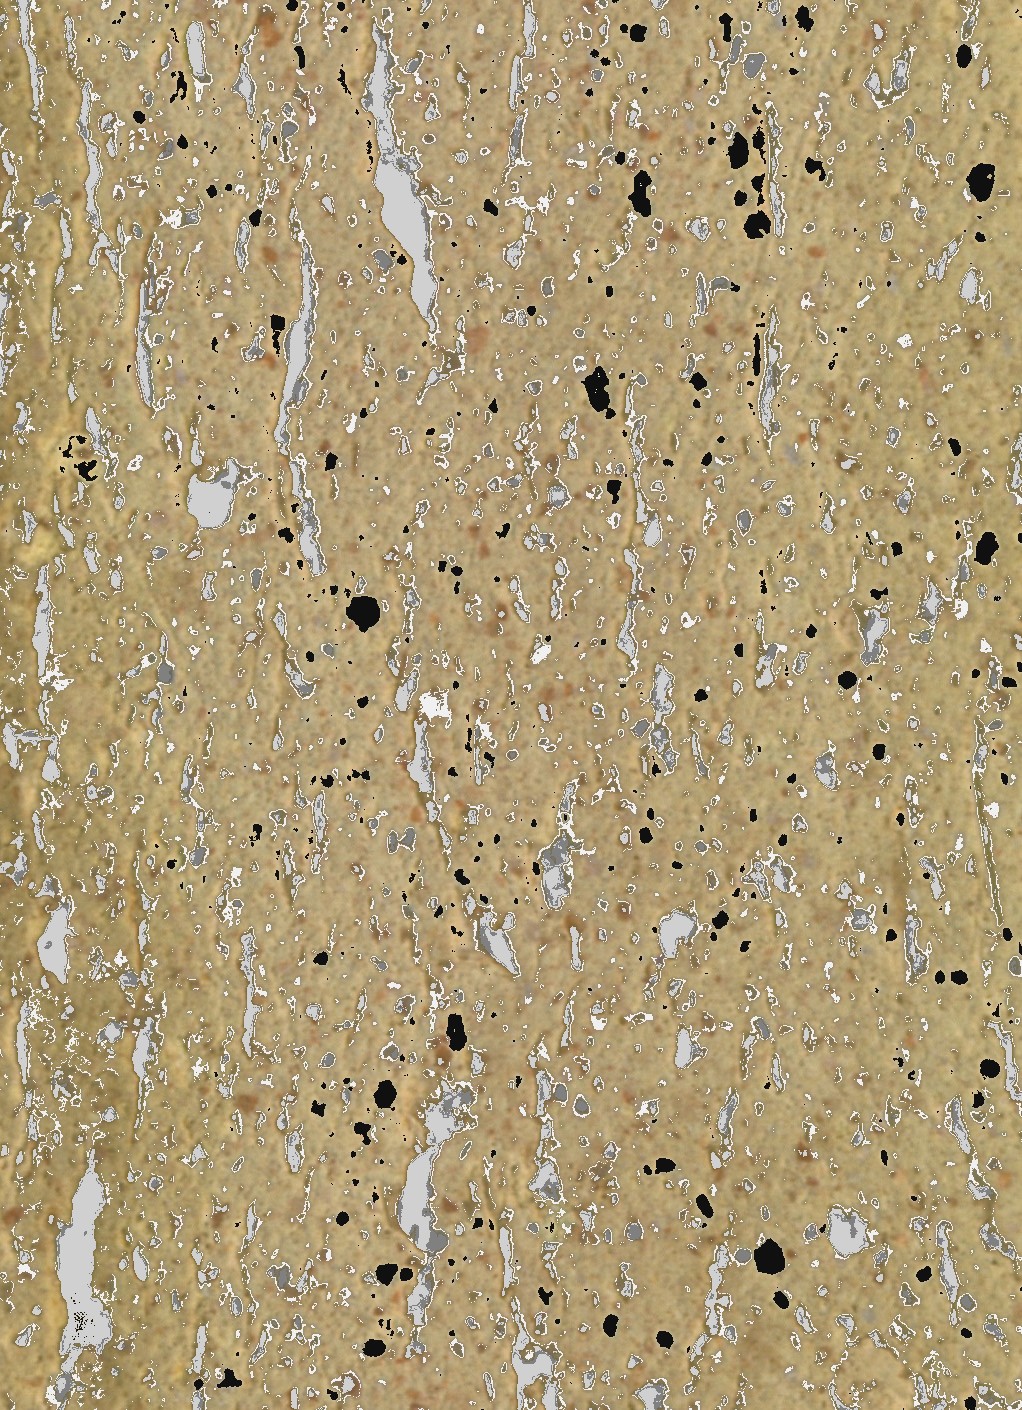
Fig. 5a-2 |
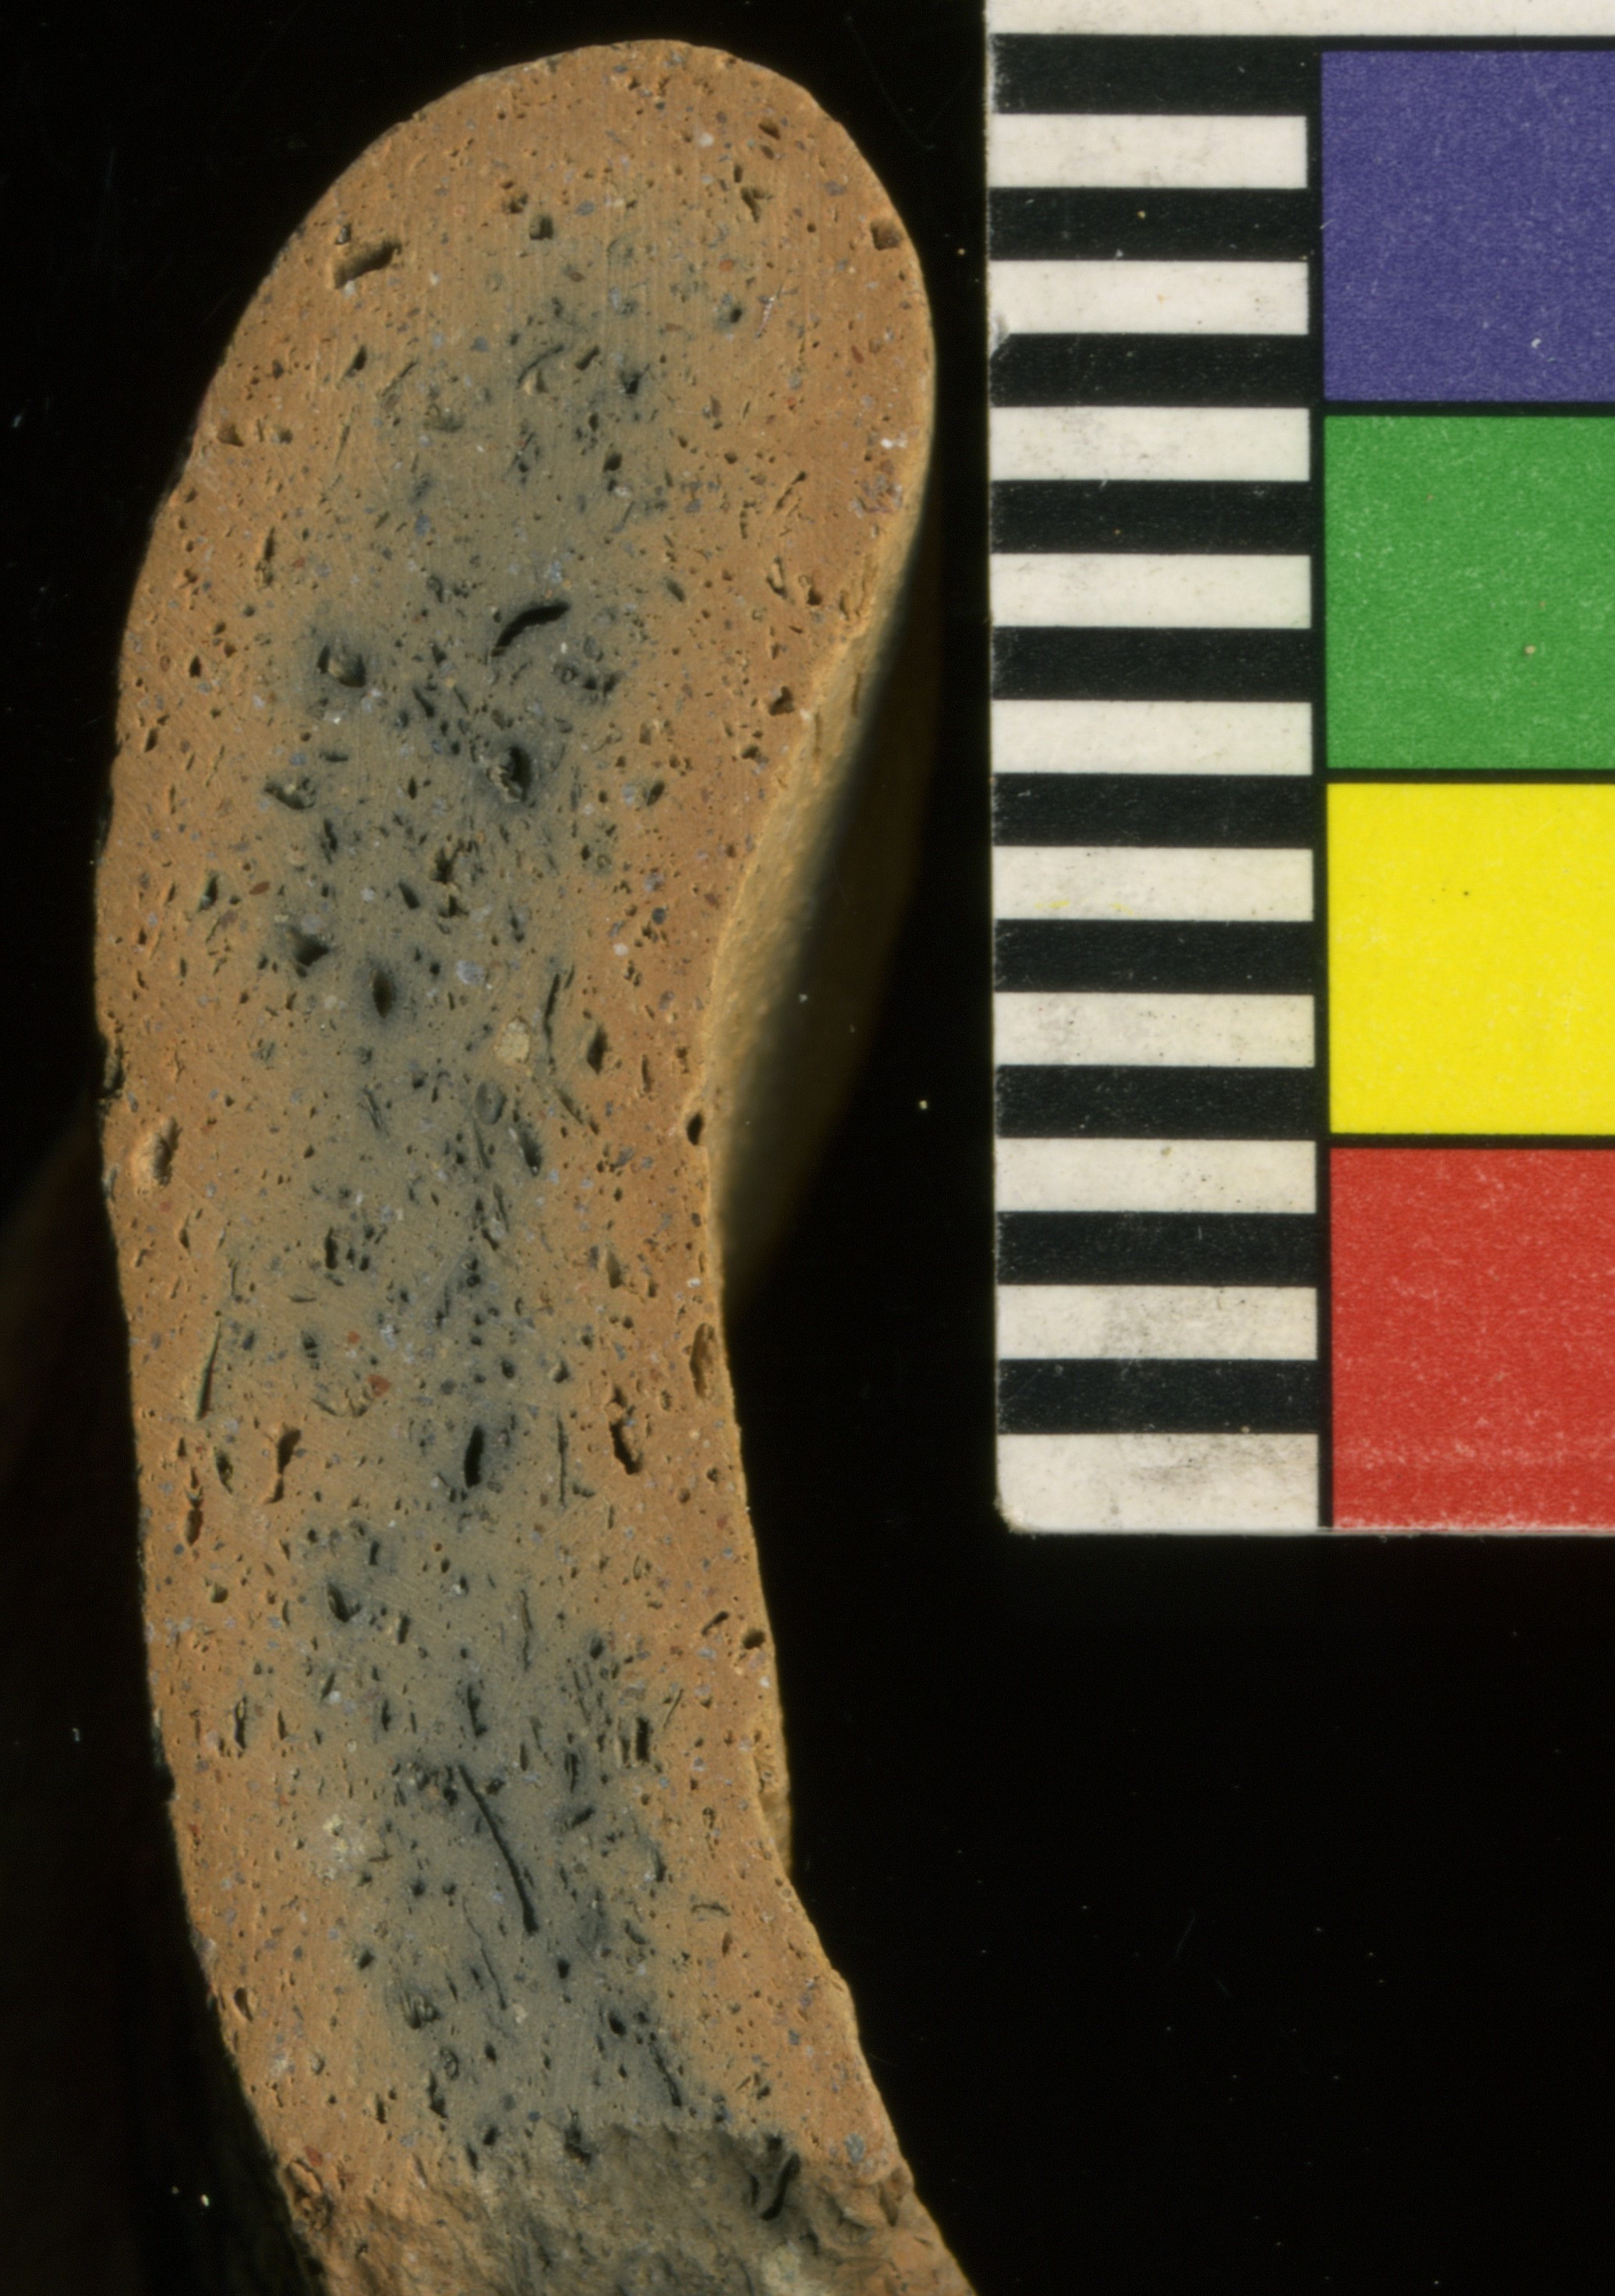
Fig. 5b-1 |
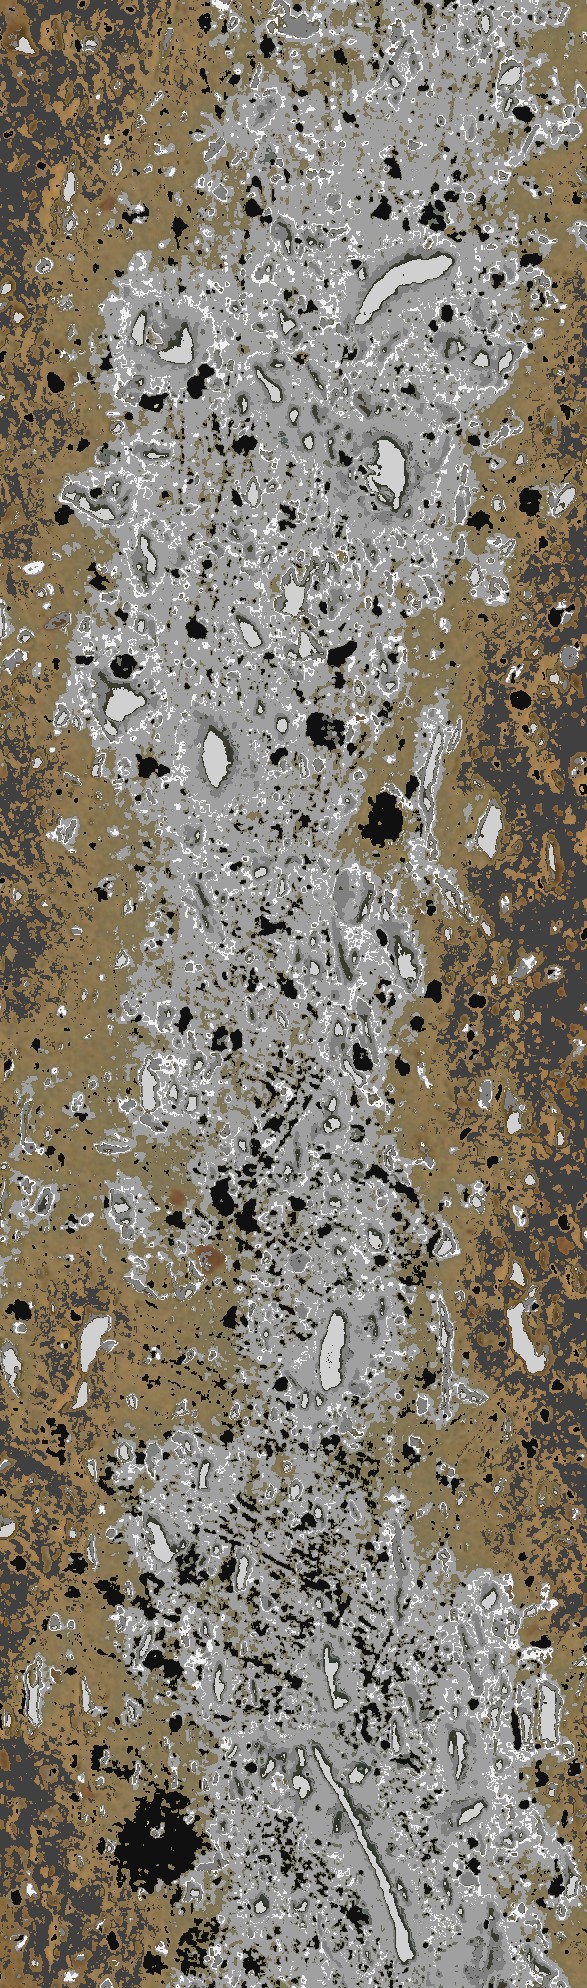
Fig. 5b-2 |
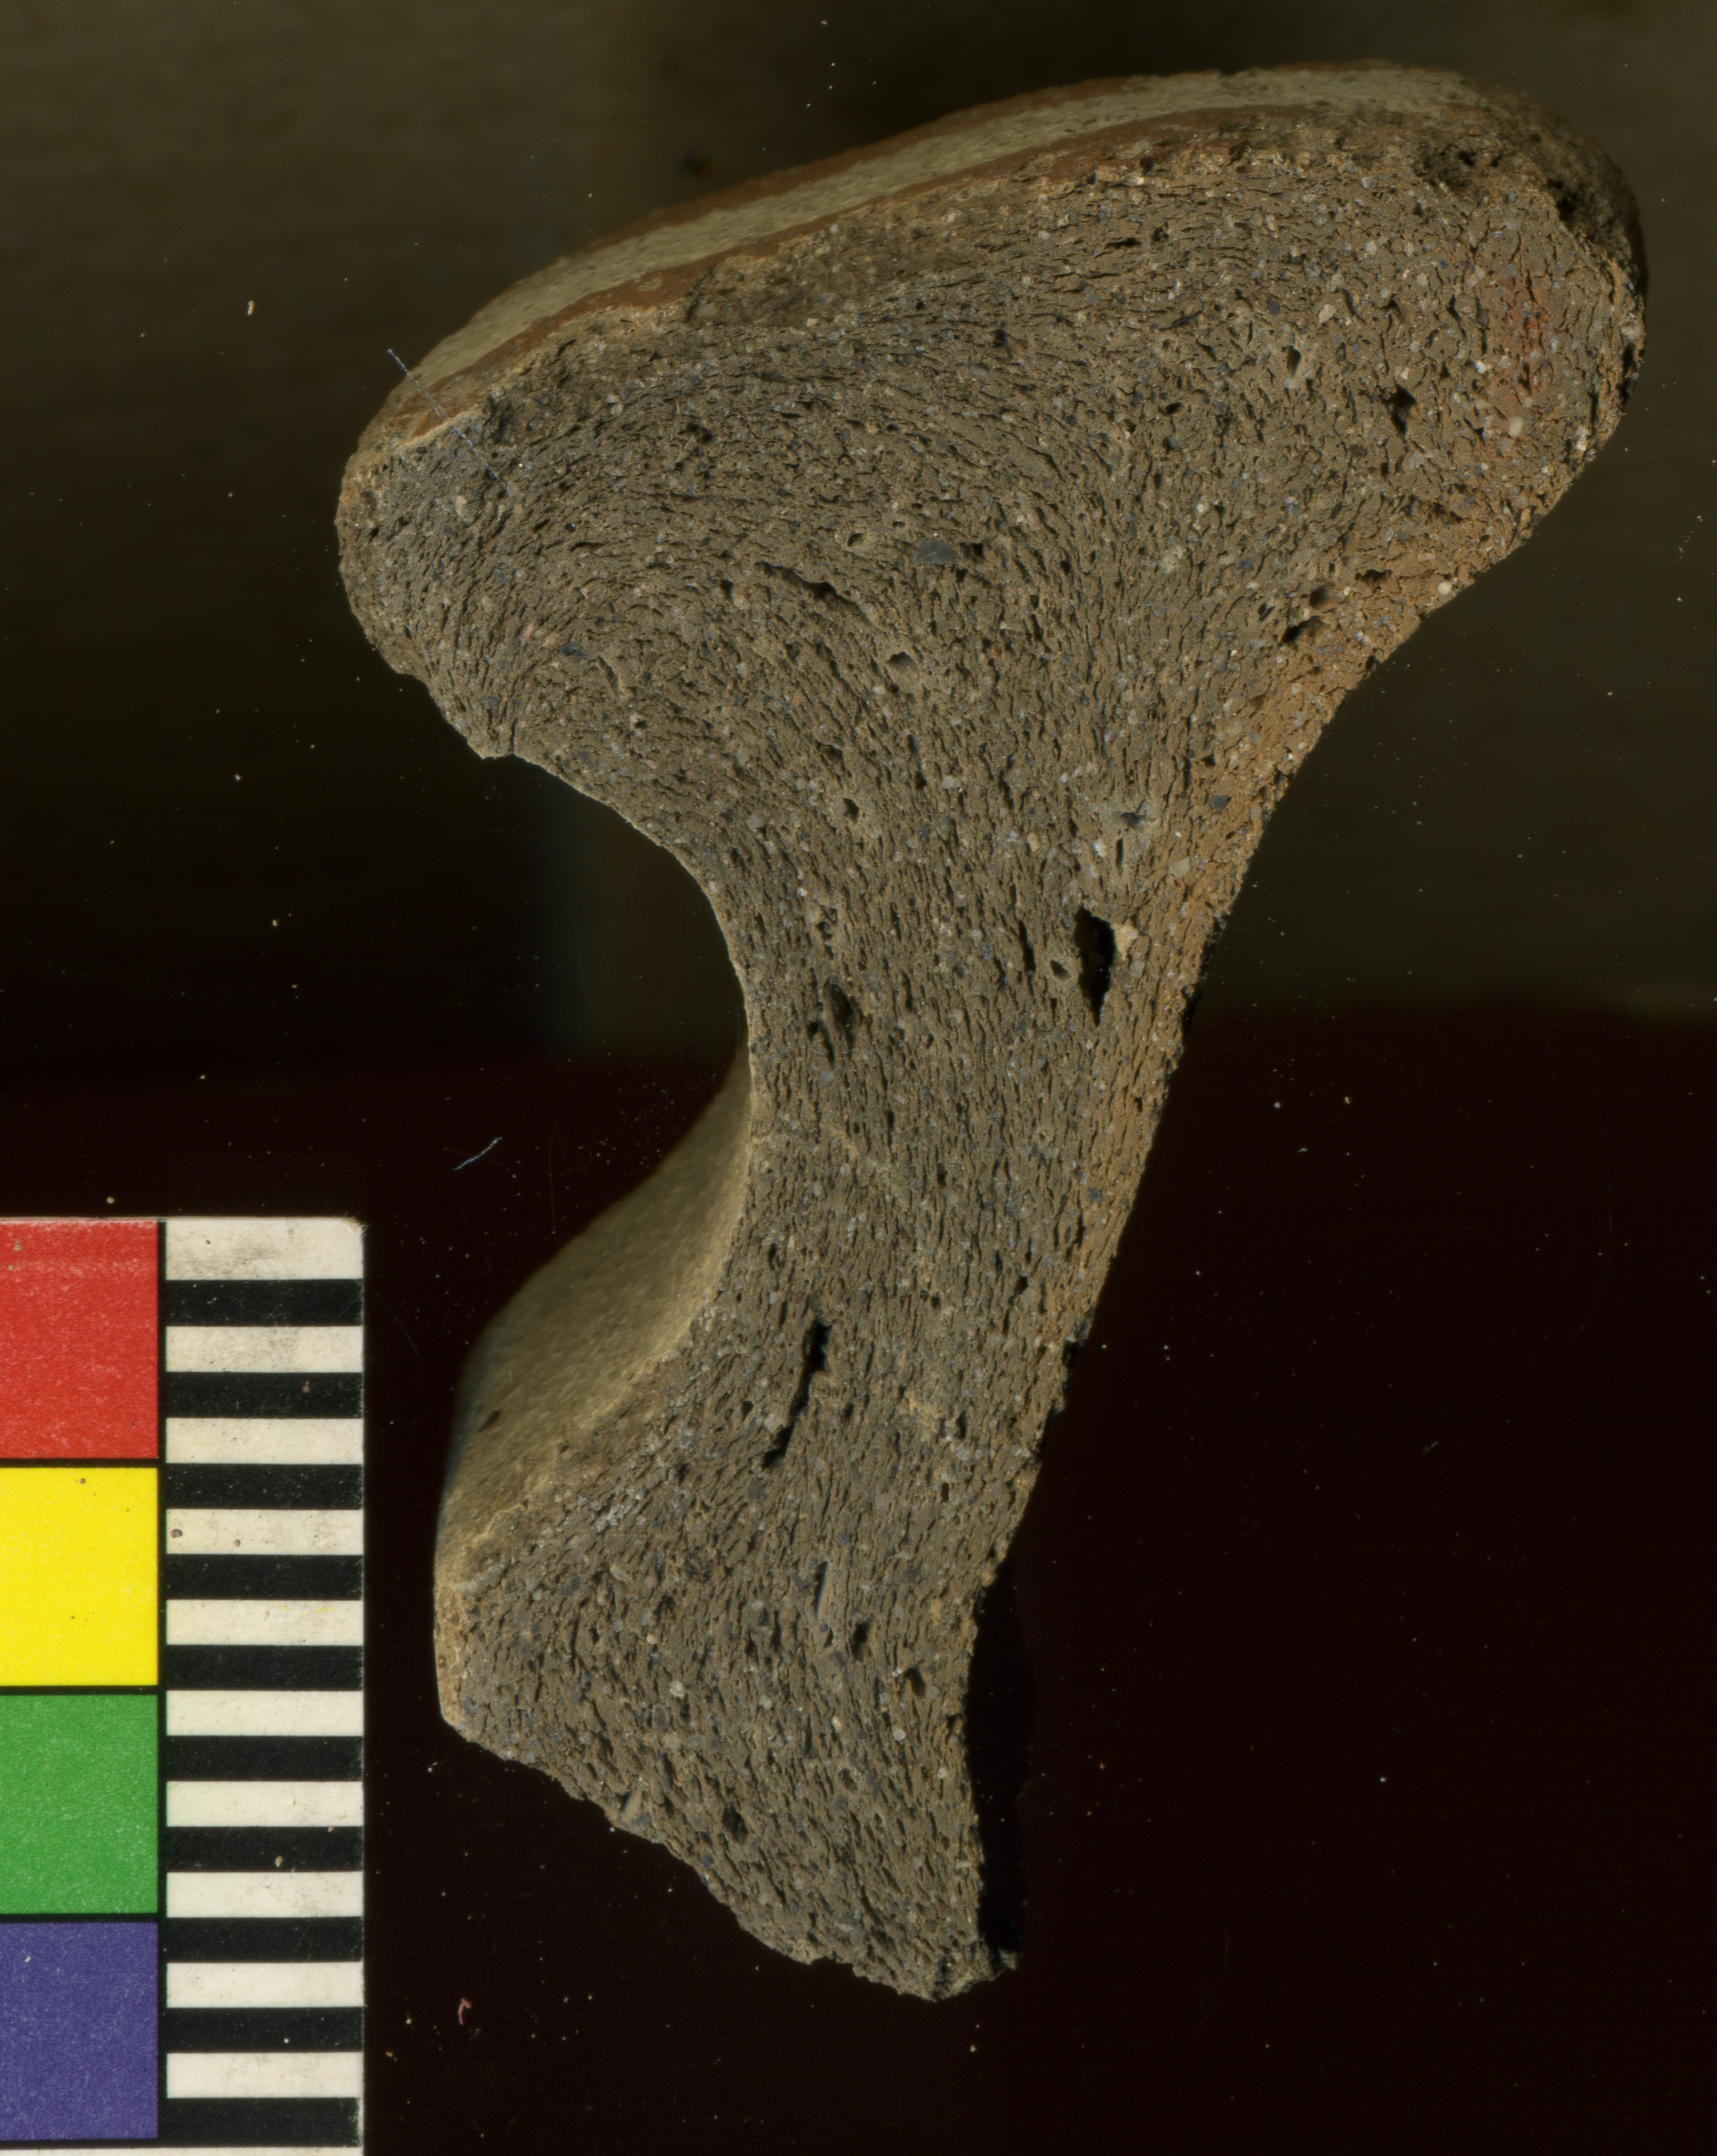
Fig. 5c-1 |

Fig. 5c-2 |
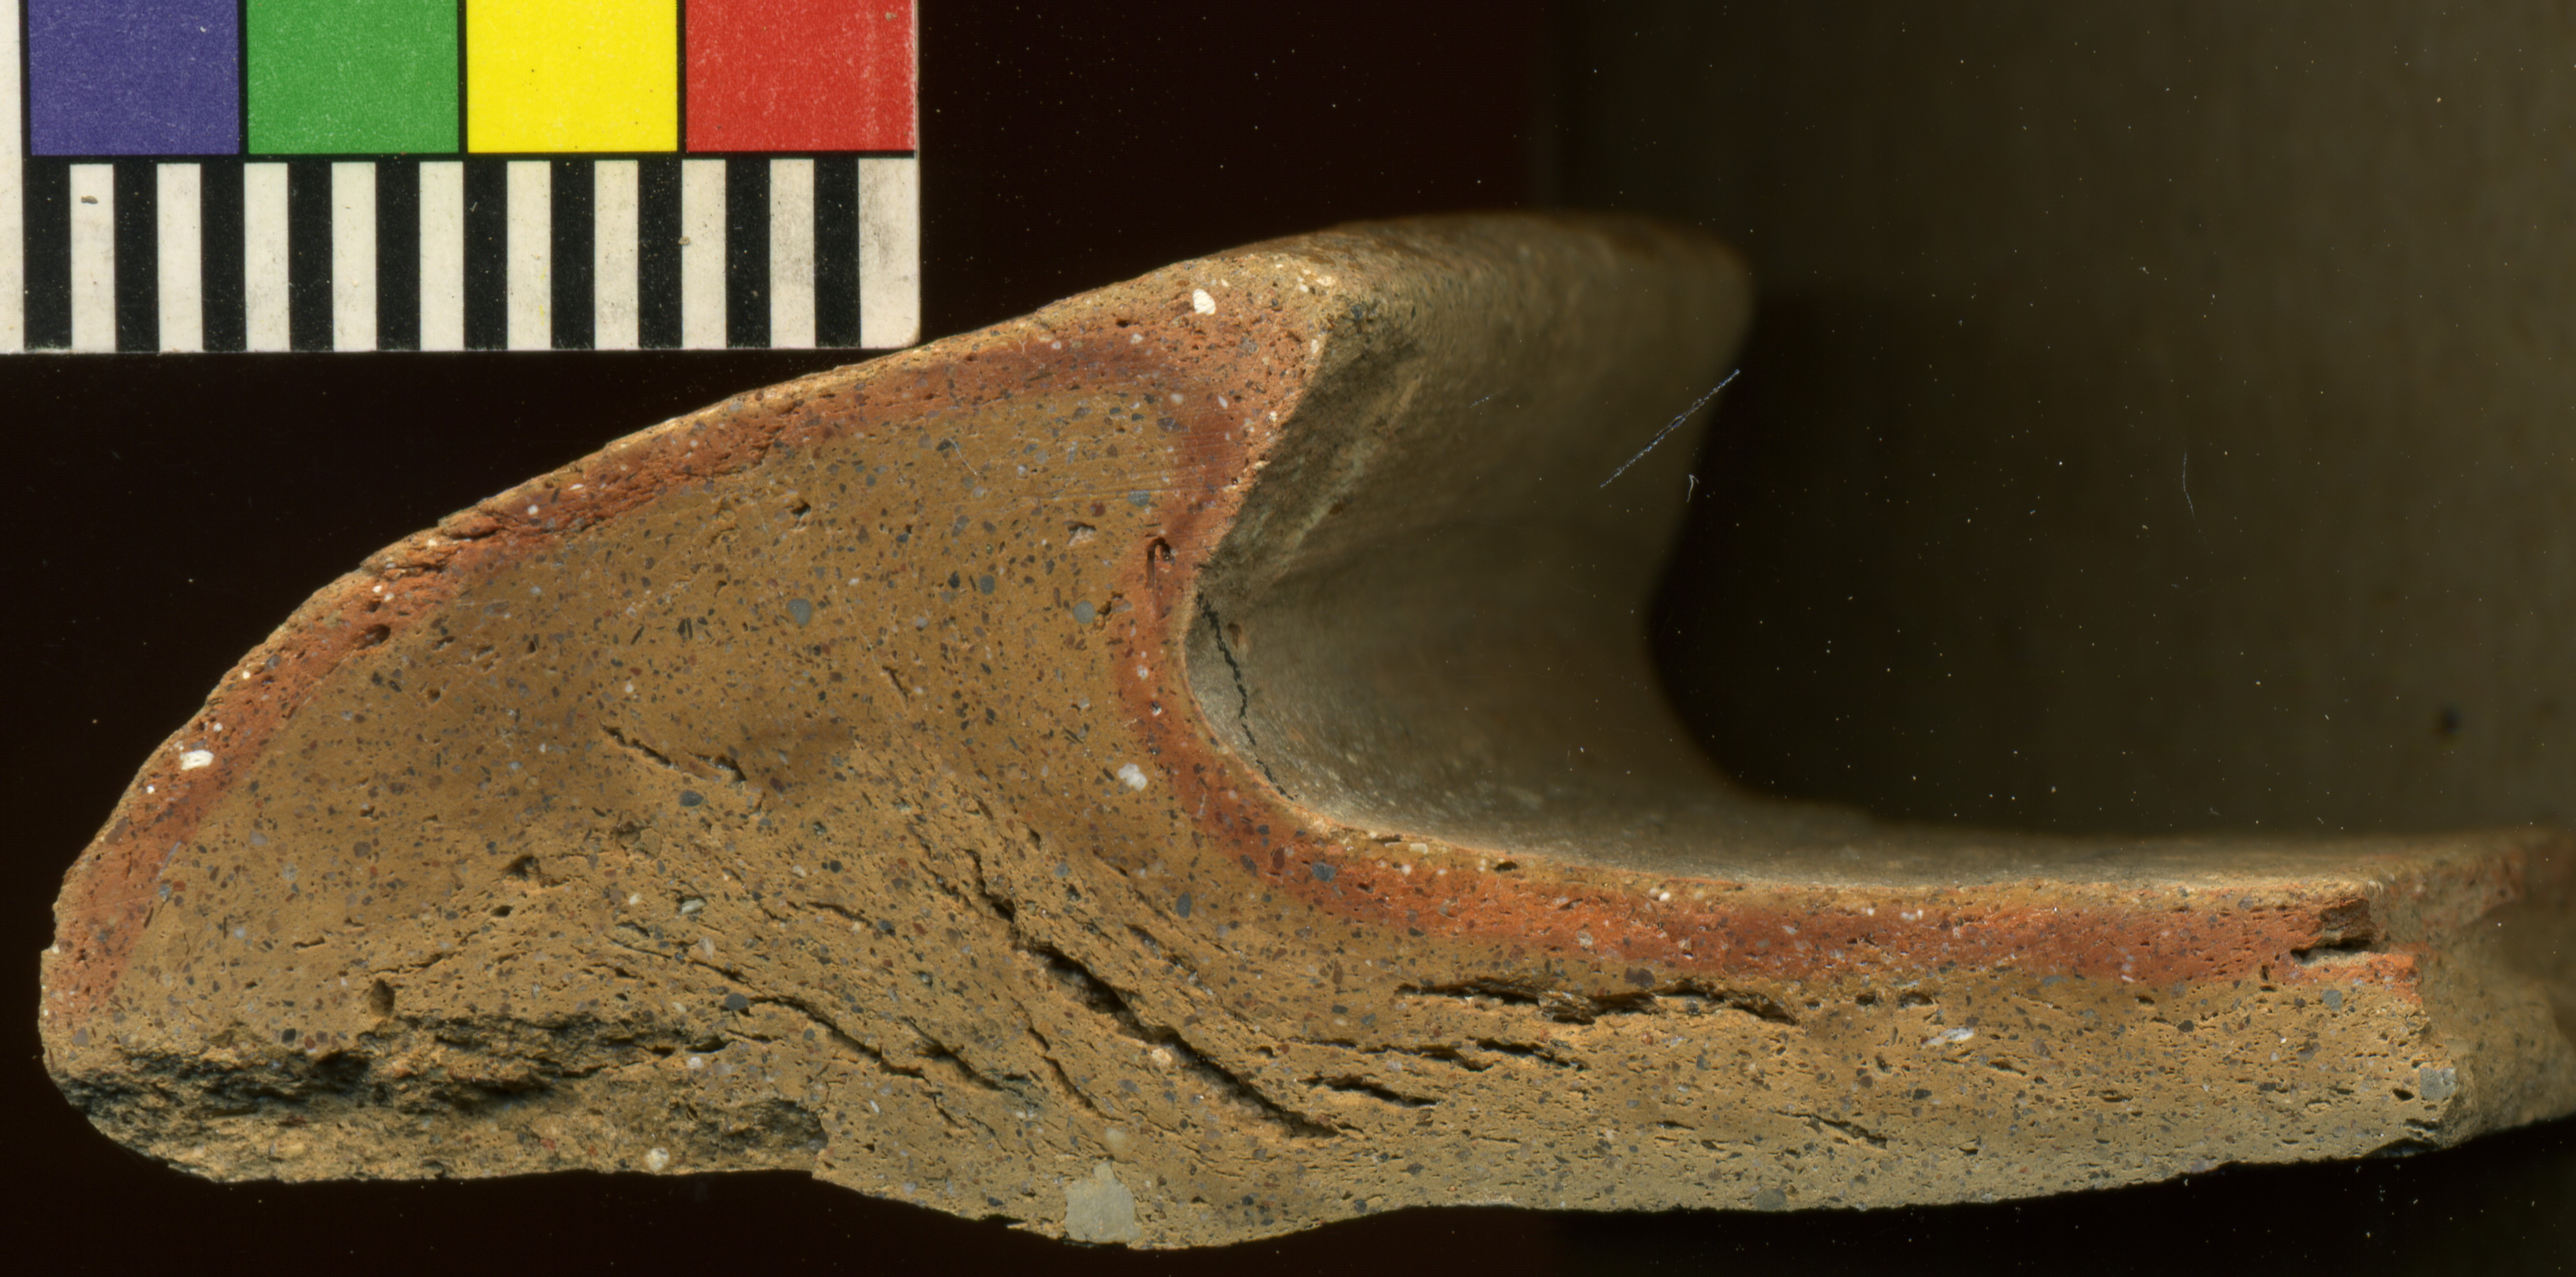
Fig. 5d-1 |
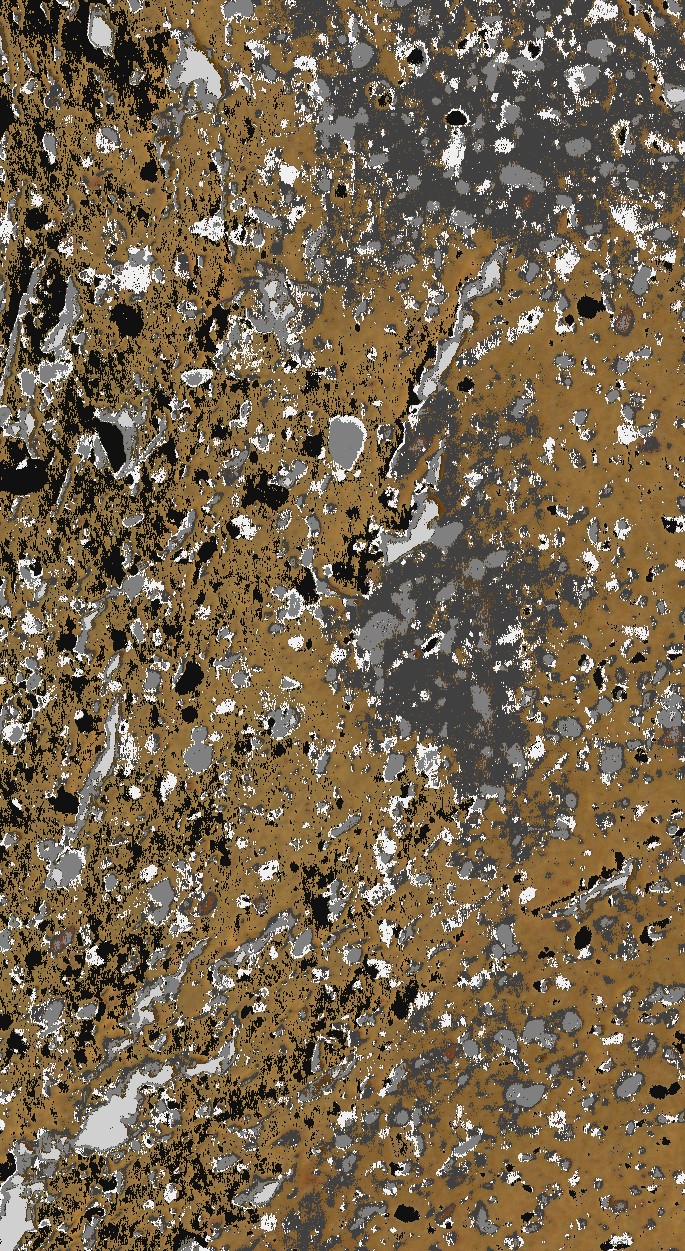
Fig. 5d-2 |
Figure 5: Comparison between Chaff Temper (CH) and Red Orange Calcite Temper (RC) fabrics from Phase 5 (a–b) and Phase 6 (c–d). CH: (a) A16q899p8f289 (photo number V22q1644); (c) A15q858p5f399 (photo number V20q1514). RC: (b) A16q901p2f289 (photo number V22q1647); (d) A15q864p4f430 (photo number V20q1544). The modal results can be found in Appendices 1a (CH) and 1b (RC), respectively. |
Back to top: Colormod
Potting Praxis
We also gained a clearer view of technical features related to potting praxis (see Shepard 1956, pp. 49-93), such as compactness of the clay body, or “stretch” marks and fissures resulting from kneading and shaping the clay or diversifying the quantity and quality of temper (Figure 5a, c; Figure 6b), or chromatic effects related to the handling of the vessel’s firing and cooling (cf Vitelli 1999; see also Figure 7). Such distinctive traits of each ware often evolved through time (cf. observations in “Categorization/Lexicon/Wares/3rd–2nd mill./Chaff Tempered Ware” and “Red Orange Calcite Temper Ware”).

Fig. 6a |

Fig. 6b |
Figure 6: Chronological evolution of Chaff Temper ware: (a) Phase 5 bowl or jar, A14q460p10f193 (photo number V22q1405); (b) Phase 6 (Khabur) deep bowl, A15q858p5f399 (photo number V20q1514). The analyzed COLORMOD images and modal results can be found in APPENDIX 1a. |

Fig. 7a-1 |

Fig. 7a-2 |
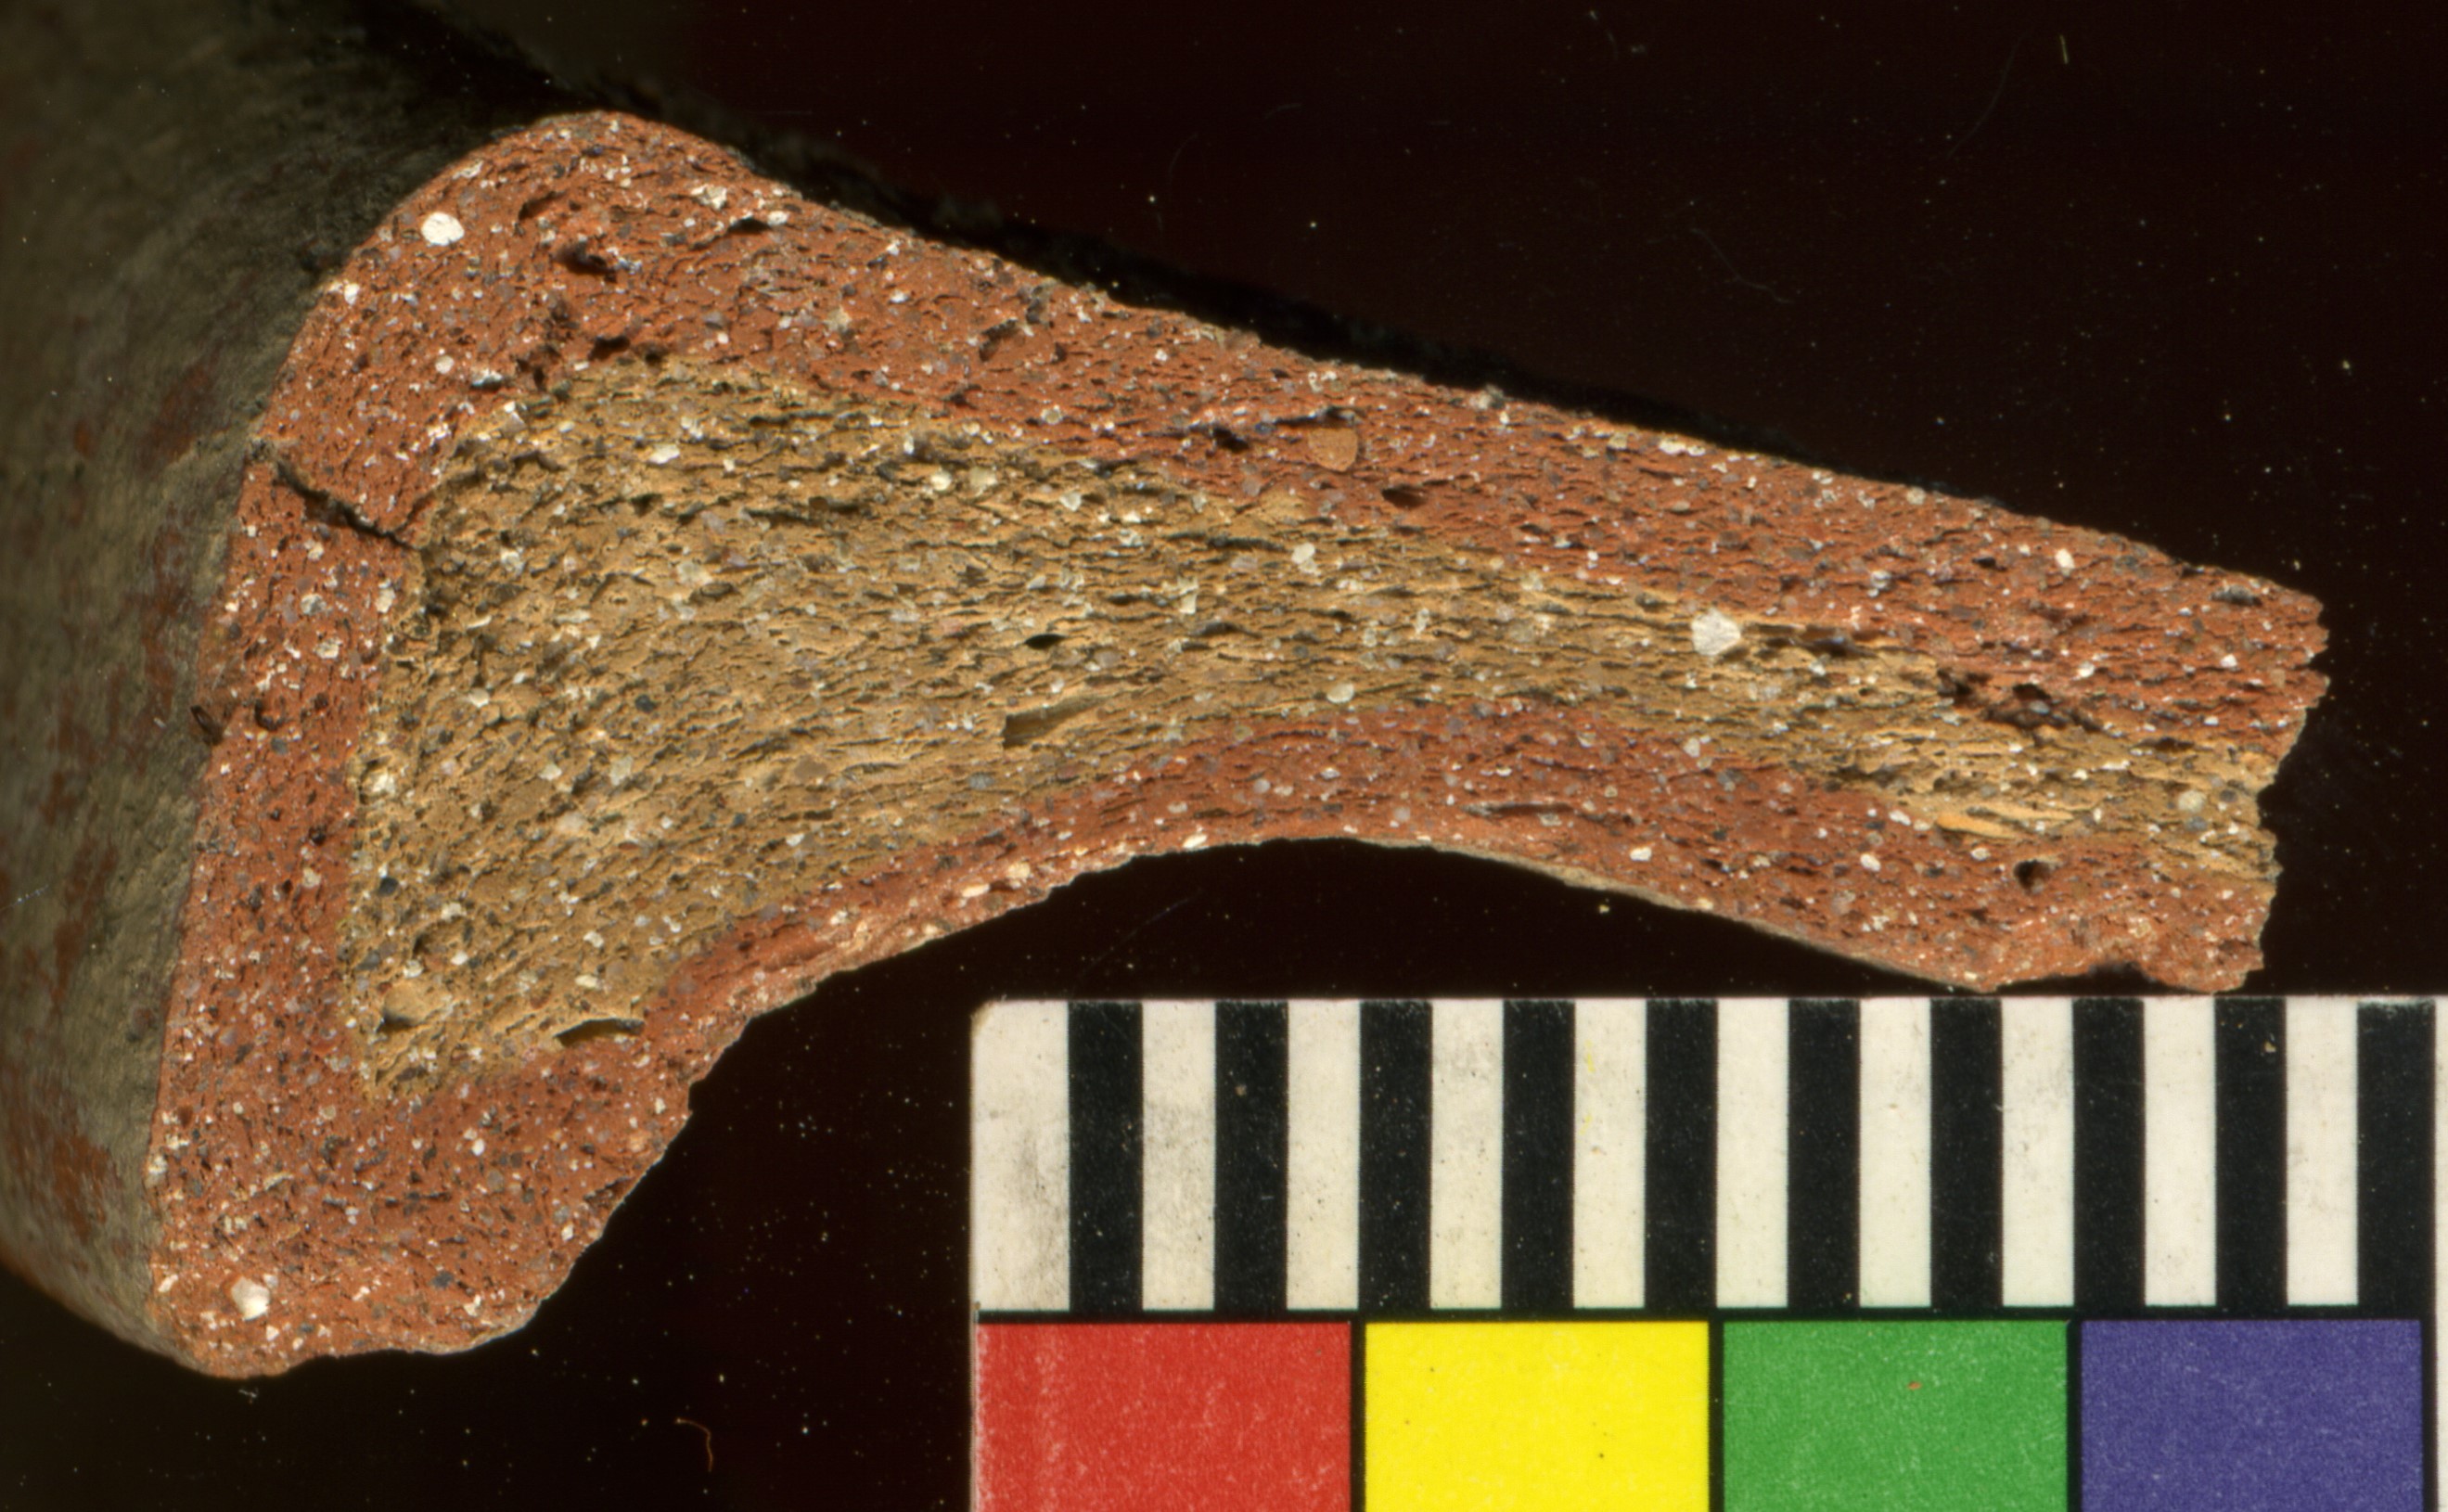
Fig. 7b-1 |

Fig. 7b-2 |
Figure 7: “Sandwiched” sections of Red Orange Calcite Temper fabrics: (a) A16q852p8f190), Phase 5; (b) A15q792p5f399 (photo number V20q1540), Phase 6. |
The tabulated results for Red Orange Calcite Ware (Table 3) exemplify the potential of the COLORMOD analysis, but also point to the limitations of the program’s macroscopic application.
| Sherd #
|
Phase
|
Shape
|
Calcite %
|
Feldspar %
|
Quartz %
|
Mica %
|
Pore %
|
Gray Core %
|
Red Wall %
|
Sum: % of total image field
|
| A16q852p8f190
|
5c
|
Jar (?) rim
|
6.25
|
5.17
|
4.39
|
|
1.34
|
|
15.09
|
32.25
|
| A16q901p2f289
|
5h
|
Jar (?)
|
6.61
|
4.7
|
5.98
|
|
2.43
|
32.08
|
10.02
|
61.82
|
| A14q430p1f181
|
5
|
Jar
|
2.79
|
|
7.64
|
2.25
|
2.41
|
|
|
15.09
|
| A14q460p2f193
|
5
|
Rim (shape?)
|
9.05
|
7.84
|
|
|
4.94
|
42.05
|
10.19
|
74.08
|
| A14q460p7f193
|
5
|
Jar
|
30.68
|
8.28
|
17.12
|
|
2.7
|
|
|
58.78
|
| A14q464p2f196
|
Bowl
|
5
|
6.11
|
|
1.18
|
|
6.69
|
|
|
13.98
|
| A14q469p6f193
|
5
|
Bowl
|
24.99
|
4.09
|
5.56
|
|
7.07
|
|
25.44
|
67.15
|
| A14q584p11f234
|
5
|
Bowl
|
7.04
|
|
4.34
|
|
10.31
|
62.63
|
|
84.31
|
| A14q550p5f234
|
5
|
Bowl
|
4.22
|
|
1
|
|
5.23
|
|
10.45
|
|
| A14q550p6f234
|
Base (shape)
|
5
|
7.8
|
13.44
|
8.18
|
|
5.68
|
|
|
35.11
|
| A14q685p12f260
|
5
|
Base (shape?)
|
4.27
|
|
|
|
1.42
|
|
|
5.69
|
| A14q692p11f223
|
5
|
Bowl
|
19.22
|
7.16
|
1.51
|
|
1.03
|
|
|
28.92
|
| A14q697p16f223
|
5
|
Jar
|
21.48
|
10.52
|
5.71
|
|
2
|
|
|
39.7
|
| A15q792p5f399
|
6a
|
Khabur jar
|
10.42
|
13.21
|
8.75
|
|
1.79
|
|
29.36
|
63.54
|
| A15q864p4f430
|
6a
|
Khabur jar
|
5.04
|
7.3
|
2.53
|
2.28
|
0.46
|
|
|
17.62
|
Table 3. Modal results of the color analysis of Red Orange Calcite fabrics, Phases 5 and 6
Back to top: Colormod
Firing technology
In terms of firing technology, we can see that the distinctive “sandwiched” section of the RC wares – red-fired wall mantle (tabulated as “Red Wall”) enclosing a lighter-colored center of yellowish or pink hue, or a gray core – is present in both phases: A16q852p8f190, A16q901p2f289, A14q469p6f193, A14q469p6f193 from Phase 5, and one of the two analyzed Khabur jars, A15q792p5f399, from Phase 6 (a thin red mantle can also be seen in the section image of A15q864p4f430 [see Figure 5d, above] although this area of the section was not color-analyzed), as well as J3q124p70f63 that was included in the microprobe analysis (see below, and APPENDIX 2). But the “sandwich” effect is particularly pronounced, both proportionately (see Table 3) and visually (color contrast, sharp layering of section areas), in the sherds of Phase 6 as compared to the softer contrasts in the Phase 5 sections (Figure 7, above). This impression was subsequently confirmed by some more sherds dating to Phase 6, which were sectioned but eventually not analyzed (see below). These stronger effects, which perhaps relate to a more rapid firing/cooling sequence, possibly represent occasional deviations (purposeful or accidental, we cannot say) from the well-established and time-tested procedures applied to the RC fabrics through time. Indeed, a few other “sandwiched” sections of Phase 6 were not different from those of the preceding Phase 5 in terms of color range or the occasional presence of gray core. In our tabulated group (Table 3, above), dominated as it is by Phase 5 pieces, gray core is seen only in three pieces from that phase: two show a pronounced central strip (A16q901p2f289 [Figure 5b, above], A14q460p2f193), while the wall of a third one is burnt through, up to the surface (A14q548p11f234) (see illustrations in APPENDIX 1b).
Back to top: Colormod
Inclusions
In terms of inclusions, the color analysis of the sherds did not reveal any significant patterns of differentiation in the fabric composition, either across shapes (bowls versus jars) or over time (Phase 5 versus Phase 6), in this particular ware. Rather, we see a fluctuation in the amount and relative proportions of non-plastic inclusions in each vessel, although the range of macroscopically identifiable minerals is pretty standardized: calcite, feldspar, quartz, and occasionally mica. The same is the case for the (now perished) organic matter that we can deduce from its “negative,” that is, the pores left in the fabric: quantities are usually low, with a few notable exceptions (A14q464p2f196, A14q469p6f193, and especially A14q548p11f234). What these, admittedly limited, data seem to show is random variation that could be explained in terms of technical practicalities and/or contingencies, such as the use of clays from different geological beds with diverse mineral composition, the availability of tempering materials, different recipes for mixing and preparing the clay paste, or the circumstances of firing. Variation may also reflect the degree of skill and experience, the know-how or preferences of different potters; or even suggest some “freedom to improvise” on the part of practitioners who generally worked within a well-established and long-lived manufacturing tradition, handed down over generations. Evolution and innovation through time has indeed been documented on the collective level for the potter communities at Urkesh. Here we may be getting additional hints of such processes at play on the personal level, too – perhaps expressions of individual technological style (a potter’s “personality”?).
Attractive as such possibilities may be, they must be entertained cautiously given the small size of the analyzed sample and the very different numerical representation of the two phases in question, 5 and 6. In addition, our findings may be skewed by the inadequacy of macroscopic analysis to achieve a fine enough level of component identification on the basis of color difference alone.
Back to top: Colormod
Color sensitivity
COLORMOD was sensitive to color elements as small as 4 pixels, that is, 4% of a millimeter across, sometimes even smaller. This allowed us to detect a very large portion of the inclusions present in the fabric, in the size of 0.2-0.3 mm and larger. However, it was often difficult to distinguish between minerals of similar color, such as dark quartzes and muscovite (mica); there was a certain threshold of distinction beyond which color values overlapped, leading to potentially biased results in the image breakdown: the largest color range that allowed identification of distinct color areas was 0–150 pixels, with up to 10 pixels overlap in one of the RGB values of each shade. For this reason we proceeded conservatively with the analysis, opting sometimes for a lower estimate and leaving out elements with very small percentile representation, which could not be meaningfully isolated. This method necessarily left out inclusions that are just tiny particles mixed in the paste. To achieve a reliable finer-grained analysis, microscopic methods were required.
Back to top: Colormod
Electron Microprobe Analysis
To “calibrate” the sherd scans, the mineral inclusions and variations in clay composition were identified using electron microprobe analysis. A total of 14 sherd samples were selected, including some of the RC sherds analyzed by COLORMOD (marked with * in the list below) as well as a few others representing units, phases, and wares that had not been included in the color analysis. The breakdown is as follows:
Late Chalcolithic (4th mill.); from Temple Terrace, revetment wall
J1: Chaff Temper (LCH)
J01q?70f196, J01q?p71f196, J01q?p72f196, J01q?p73f196, J01q?p74f196
3rd–2nd mill.
A14 RC Phase 5
*A14q460p7f193, *A14q469p6f193, *A14q692p11f223
A16 RC Phase 5
*A16q852p8f190
A15 RC Phase 6
*A15q792p5f399, *A15q864p4f430
J3: Temple Terrace, inside of revetment wall RC
J3q124p70f63 (Phase 6), J3q106p70f63 (Phase 7)
J4 (location onsite?): Fine Chaff Temper (FC) Phase 7
J4q200p70f89
Back to top: Colormod
Sample group: catalog
A catalogue of the sample group, complete with all the BSE images and element maps for each sherd, can be found in APPENDIX 2. The analysis was conducted by Ellery Frahm, at the University of Minnesota, The following description of the procedure was first published in Frahm, Nikolaidou, and Kelly-Buccellati 2008, p. 9:
“The sherds were cut, mounted in epoxy plugs, and polished using standard procedures for preparing geologic samples for electron microprobe analysis. We examined the prepared sherds using a JEOL 8900R “SuperProbe” Microanalyzer equipped with five wavelength-dispersive spectrometers (WDS), an energy-dispersive spectrometer (EDS), and secondary-electron (SE) and backscattered-electron (BSE) detectors in a 1x1 mm and a 10x010 mm (wide) field of view. We used a combination of electron microscopy and X-ray microanalysis to identify the mineral inclusions and establish the clay chemistry. After the mineral inclusions (both the deliberately added tempers and particles intrinsic to the clay) were identified, we utilized the WDS system to map the concentrations of ten geologically important elements, showing the abundance and distributions of different minerals as well as chemical variations in the clay. The resulting element maps allowed us to visualize the differences among wares. We also used them to identify the inclusions in our flatbed-scanner images, allowing us to extrapolate to the larger set of 500 scanned sherds.” (Figures 8-11)

Fig. 8a |
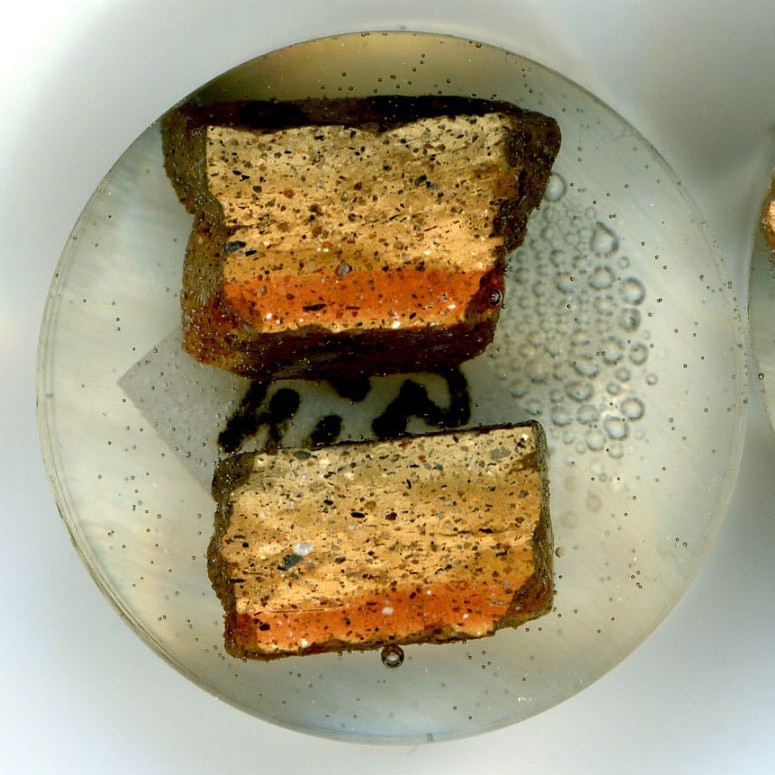
Fig. 8b |
Figure 8: Petrographic sections of (a) A14q469p6f193 (see 1b), and (b) A15q864p4f430 (see Figure 5d, above). |

Fig. 10a-1 |

Fig. 10a-2 |
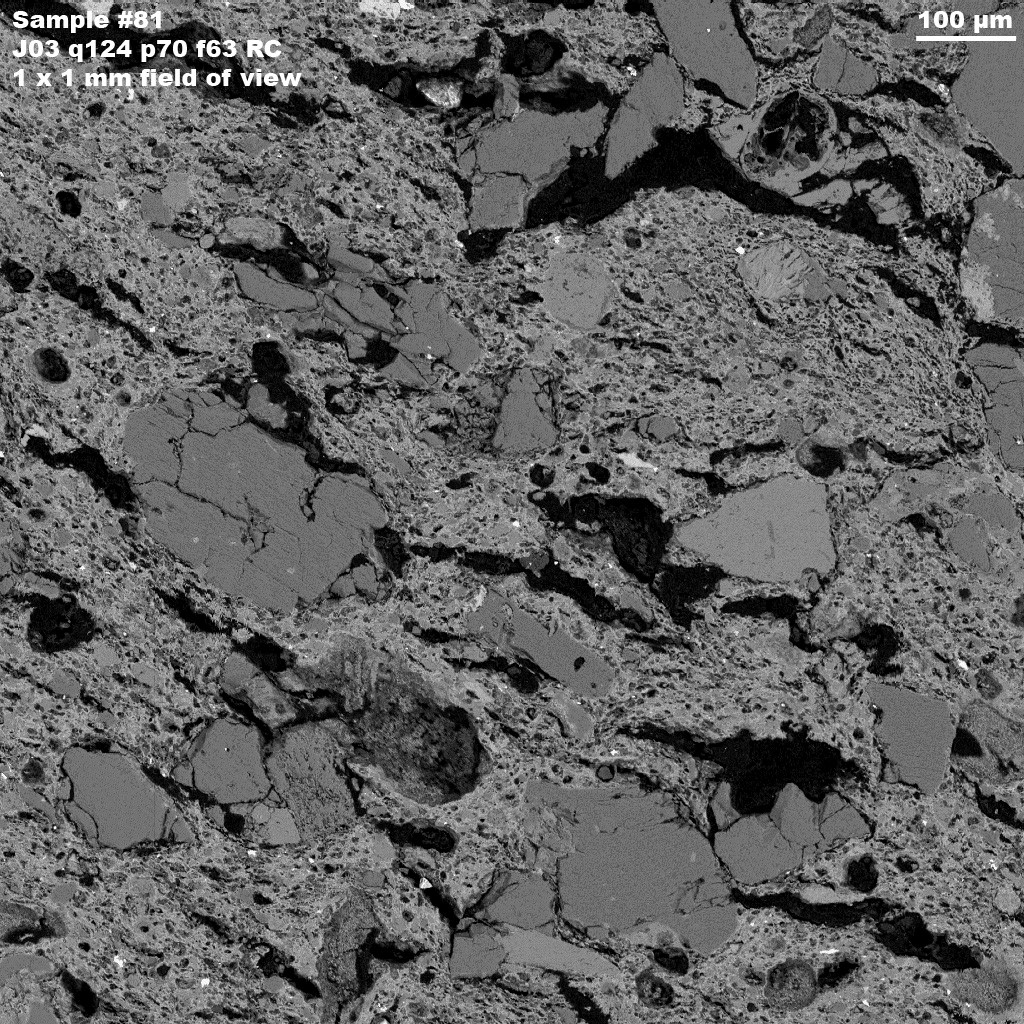
Fig. 10b-1 |
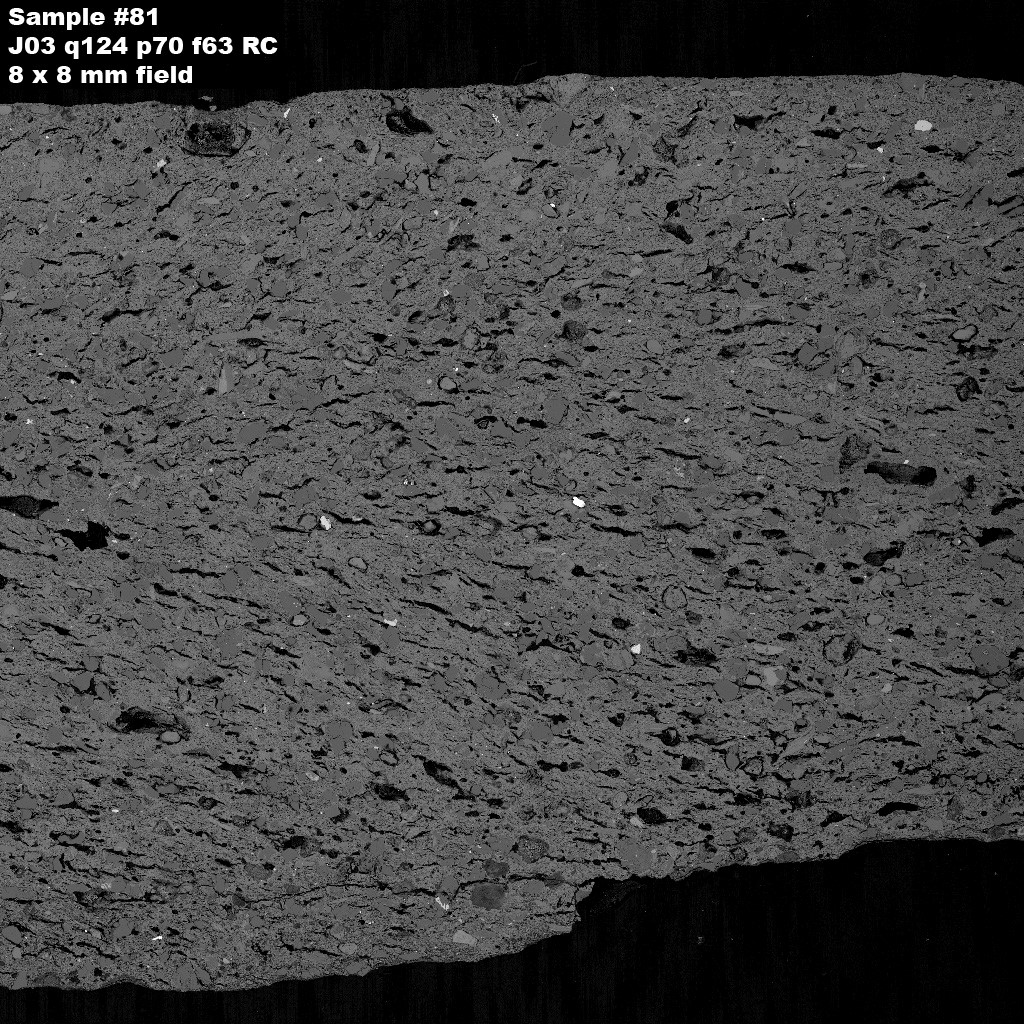
Fig. 10b-2 |
Figure 10: BSE images (1x1 mm and 10x10 mm) of (a) Late Chalcolithic LCH sherd, J01q?70f196; (b) Phase 7? RC sherd, J3q106p70f63. |
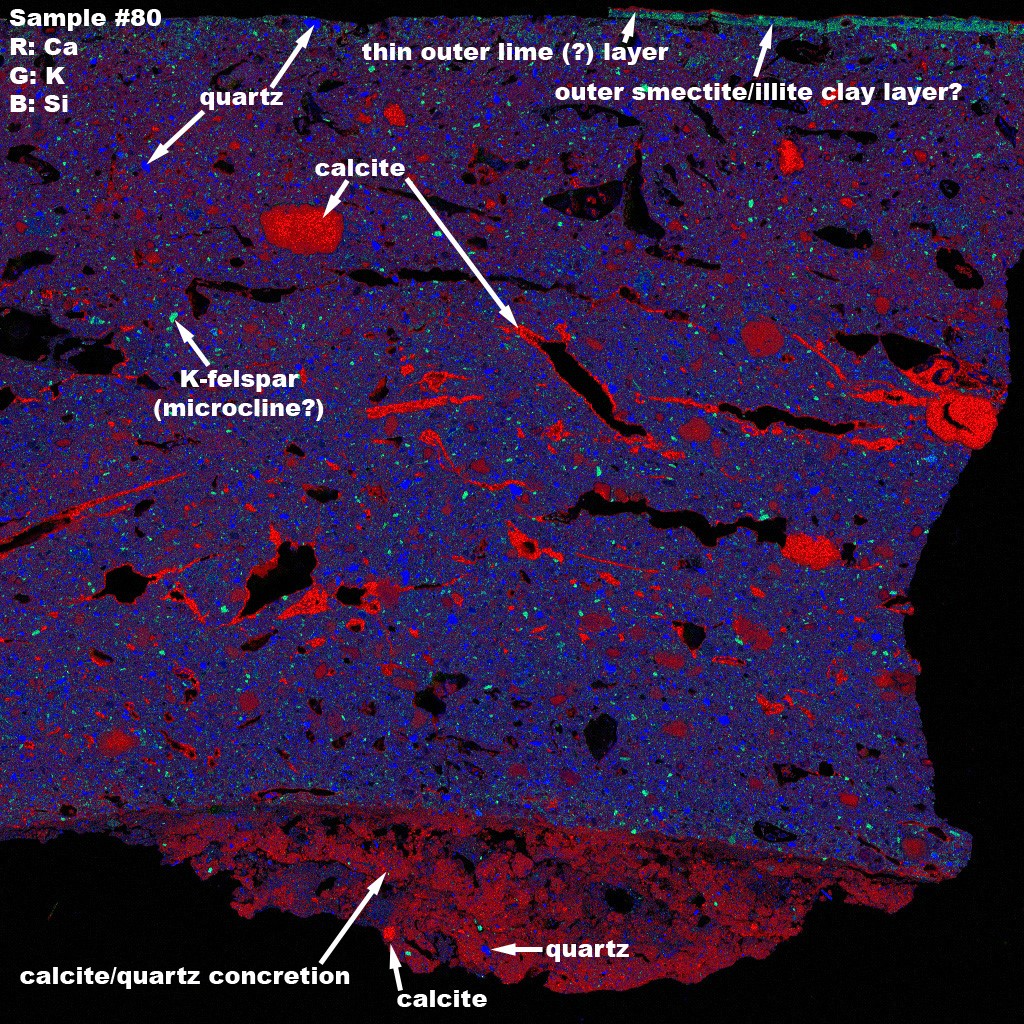
Fig. 11a |

Fig. 11b |

Fig. 11c |
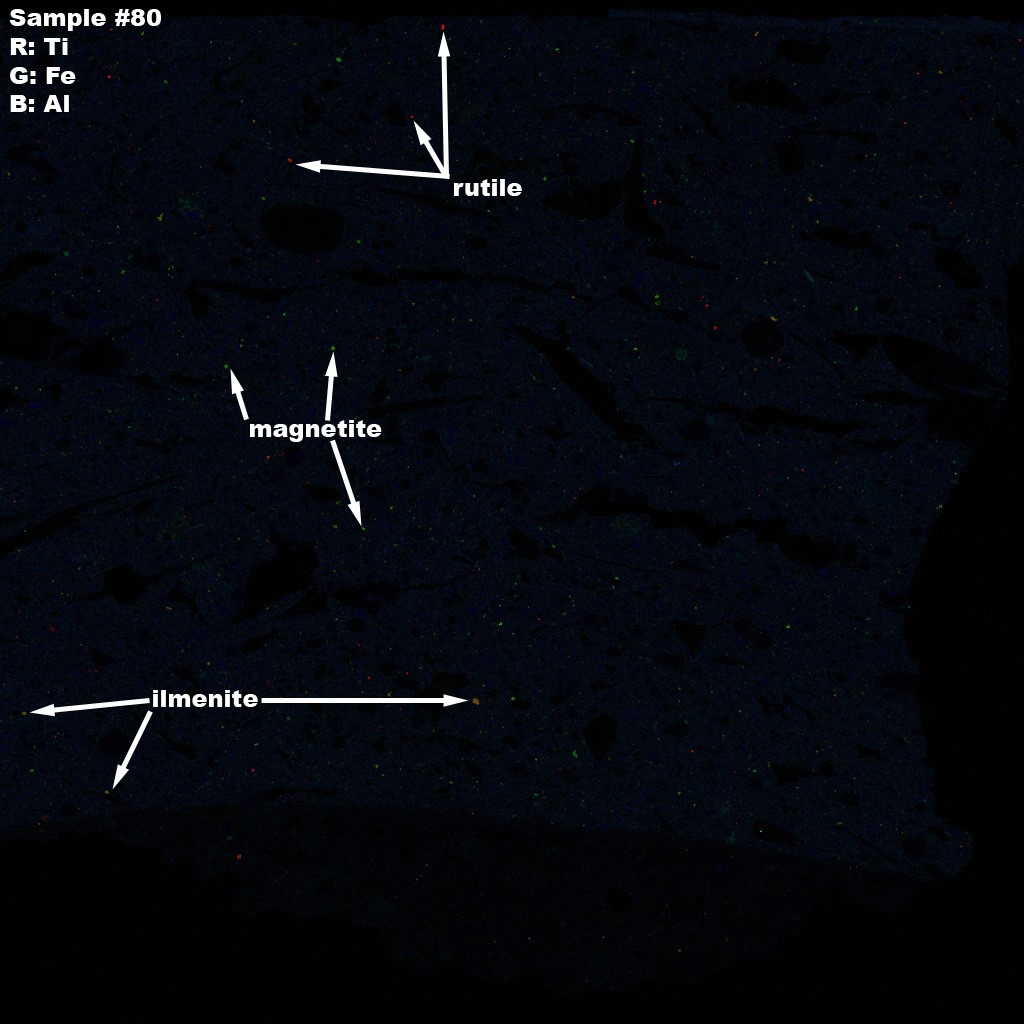
Fig. 11d |
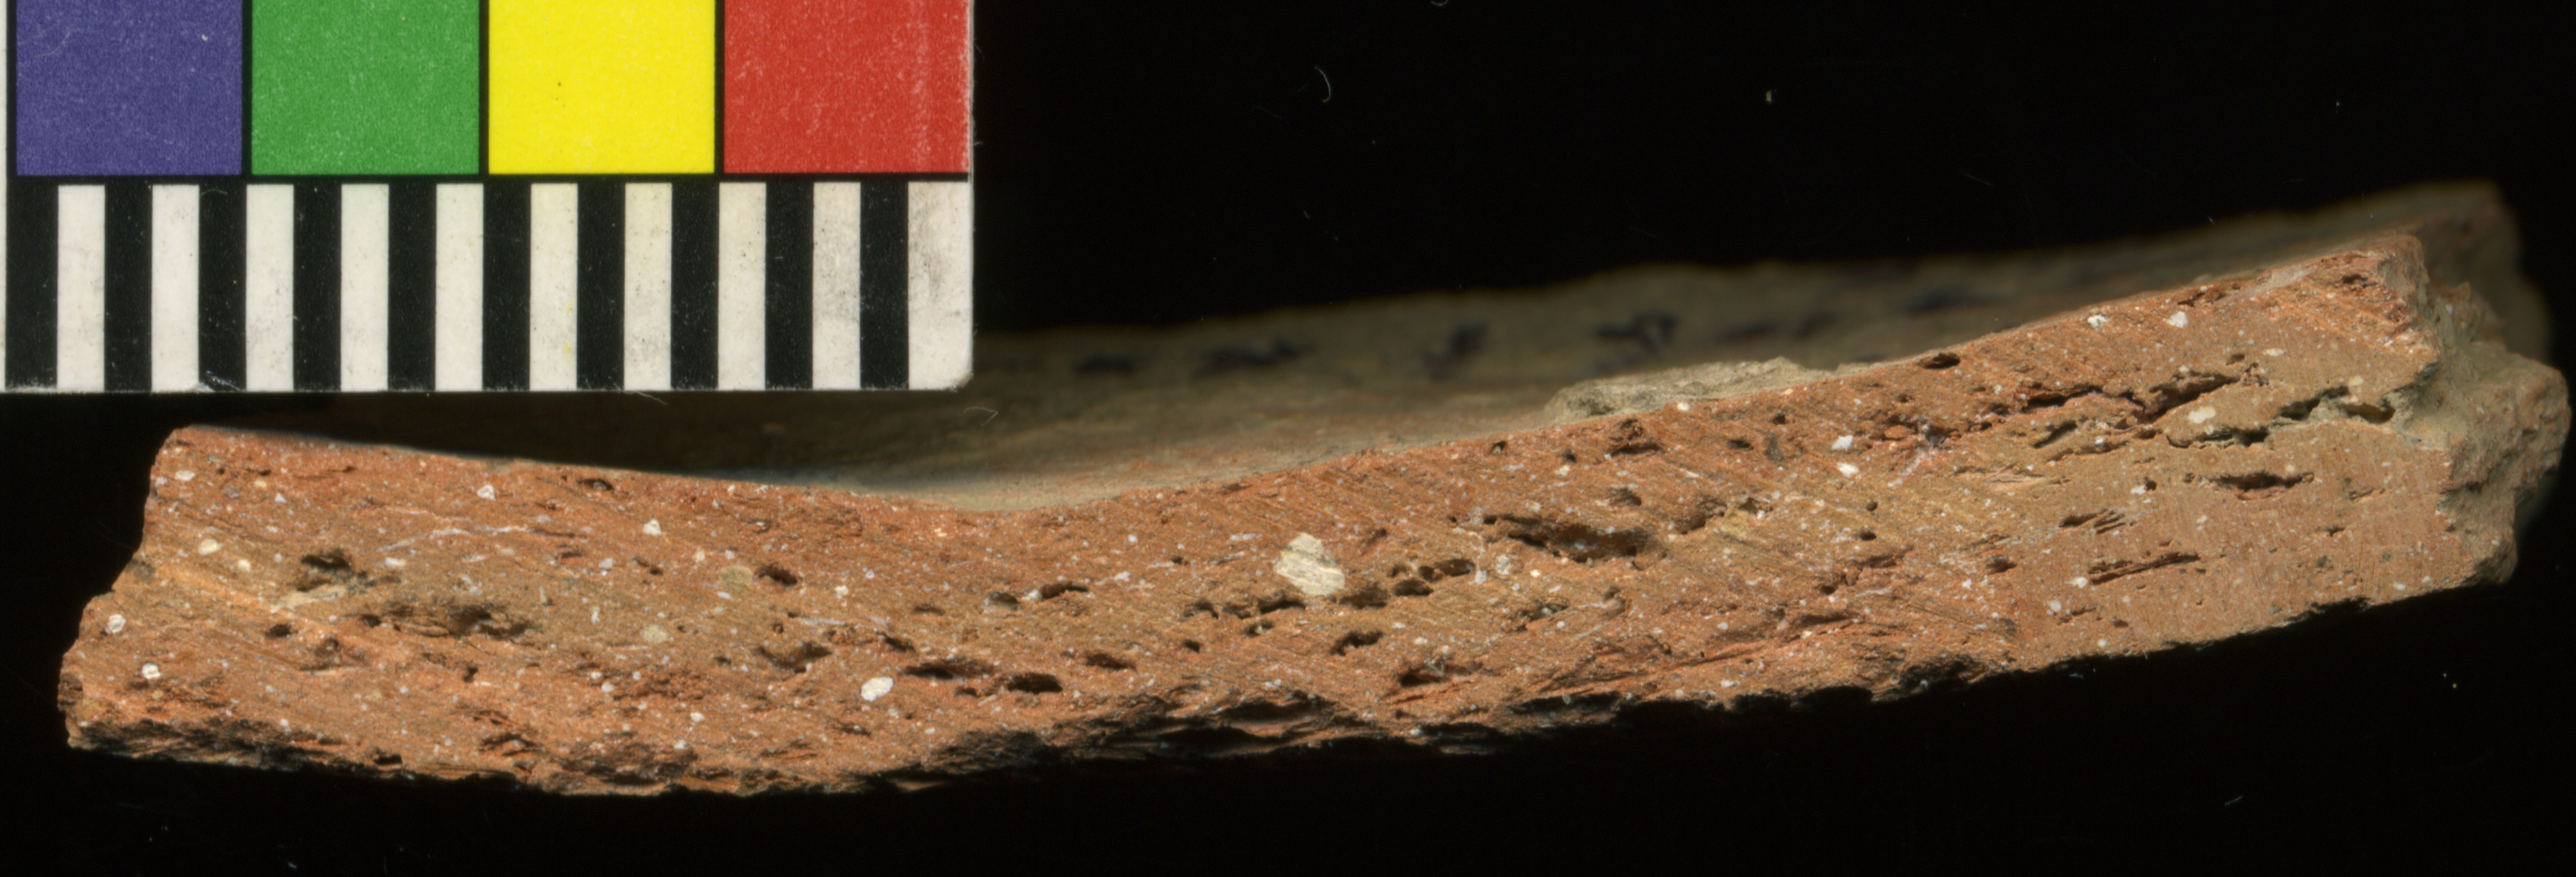
Fig. 11e |
Figure 11: X-ray element maps and section image (photo number V23q4002) of J3q106p70f63 (see Figure 10b, above), an RC thin-walled vessel of Phase 7 (Mittani). |
Figure 11 exemplifies the correspondence between microanalysis, high-resolution imaging, and the macroscopic observation of fabrics. The Red Orange Calcite Temper ware of the Mittani period is described as having “More variation in size between large and small calcite inclusions; even thin-walled painted goblets can have rehydrated calcite inclusions on the surface. This is interesting because of questions of technical control and praxis… Little chaff temper added and when present is usually small and sub-round, however a few long thin holes are seen. Some large and small gray lithic temper. Can have ‘sandwich’ section but this is not common; when it occurs it is more common in goblets and other thin-walled vessels”.
Back to top: Colormod
“Calibrating” the analyses
Combined petrographic and image analyses of representative sherd samples has allowed us to confirm categorizations of fabrics that had been established during the macroscopic analysis of our ceramics. These analyses have also provided a better understanding of the technological patterns behind these categories, and have shed light on interesting aspects of the corpus that had previously been little noticed or poorly understood.
Back to top: Colormod
1. Chronological variations in the composition of calcite-tempered ceramic wares
This is a broad category which includes mass-produced table and storage wares in a variety of forms and size s. Over the three time periods covered by the analyses, Phases 5 to 7, there is an increase in the abundance and sizes of inclusions other than calcite (for example, quartz, feldspar) and a decrease in the amount of organic temper (Figures 7, 11, 12). Several explanations could account for this shift: special recipes developed for specific types of large vessels that are best made using tempered clays; differing availabilities of raw materials for tempering over time; and/or changes in the potters’ technical know-how or preferences or desire to experiment. All these possibilities deserve further exploration.
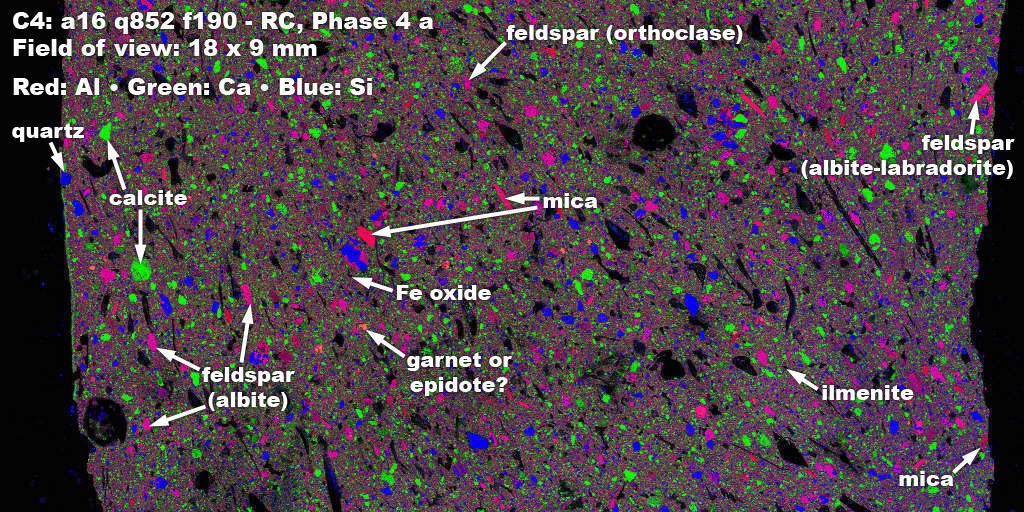
Fig. 12a-1 |
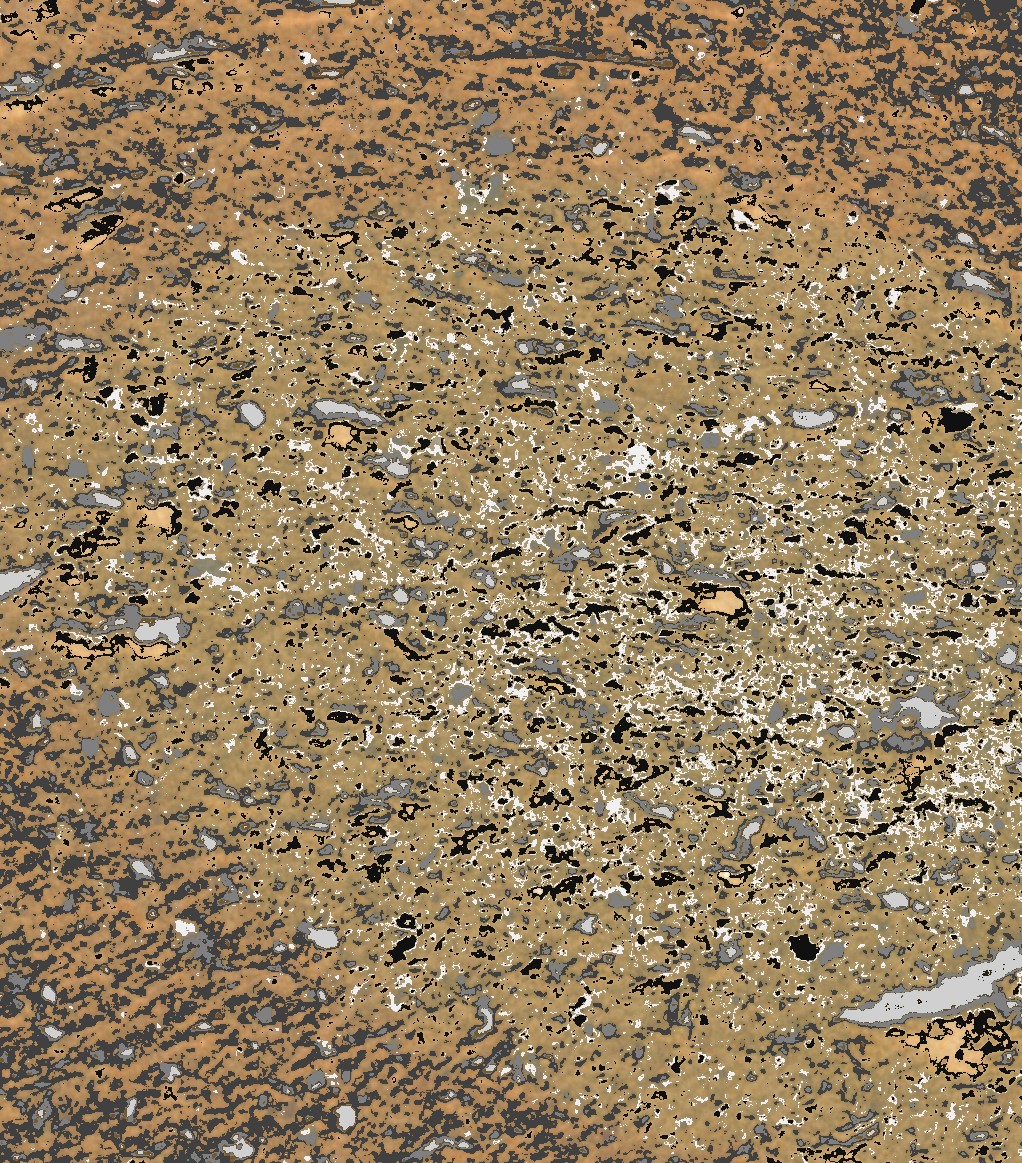
Fig. 12a-2 |

Fig. 12b-1 |

Fig. 12b-2 |
Figure 12: Element maps versus COLORMOD-generated images for (a) A16q852p8f190, Phase 5; (b) A15q792p5f399, Phase 6a. For the modal results of the COLORMOD analysis see Table 3, above; APPENDIX 1b. |
Back to top: Colormod
2. Clearer distinctions among broadly related but distinct wares, such as the chaff- tempered and calcite-tempered wares
(Figures 5, 13). These two categories coexist for considerable periods of time, although in varying ratios. At times they are difficult to distinguish macroscopically. Now we could measure the compositional differences between them and correlate these differences with specific vessel forms and sizes.
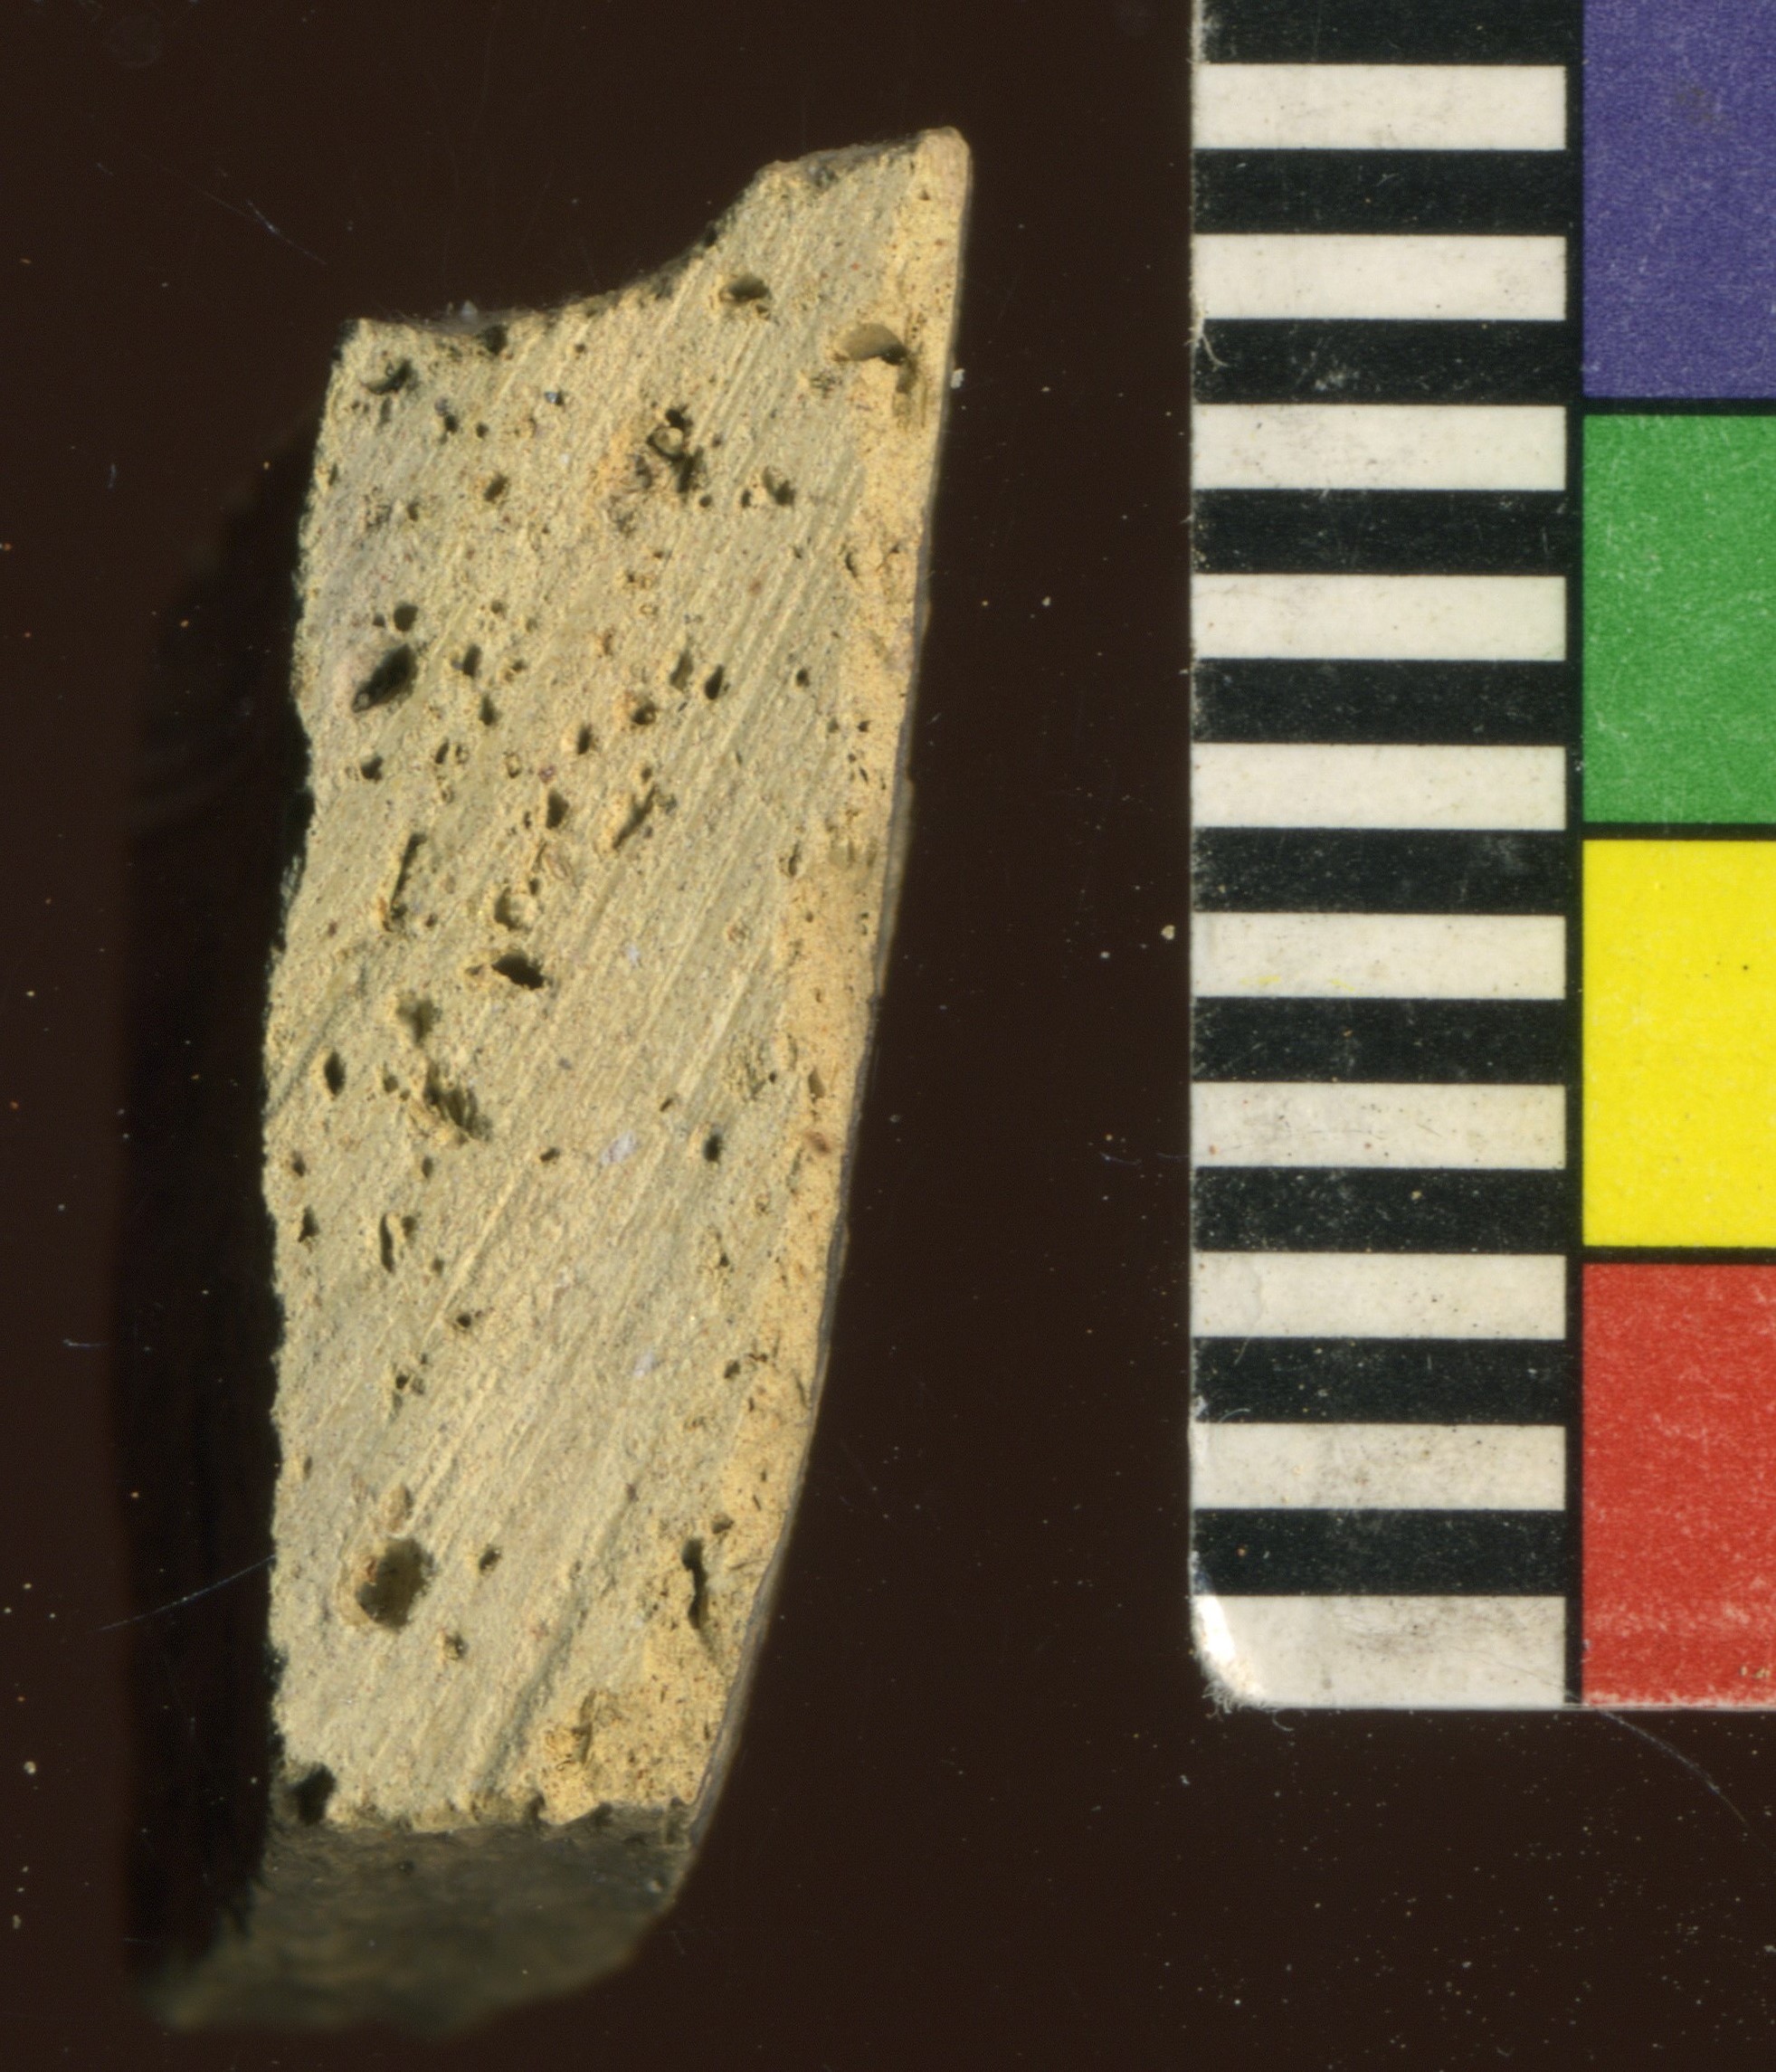
Fig. 13a-1 |
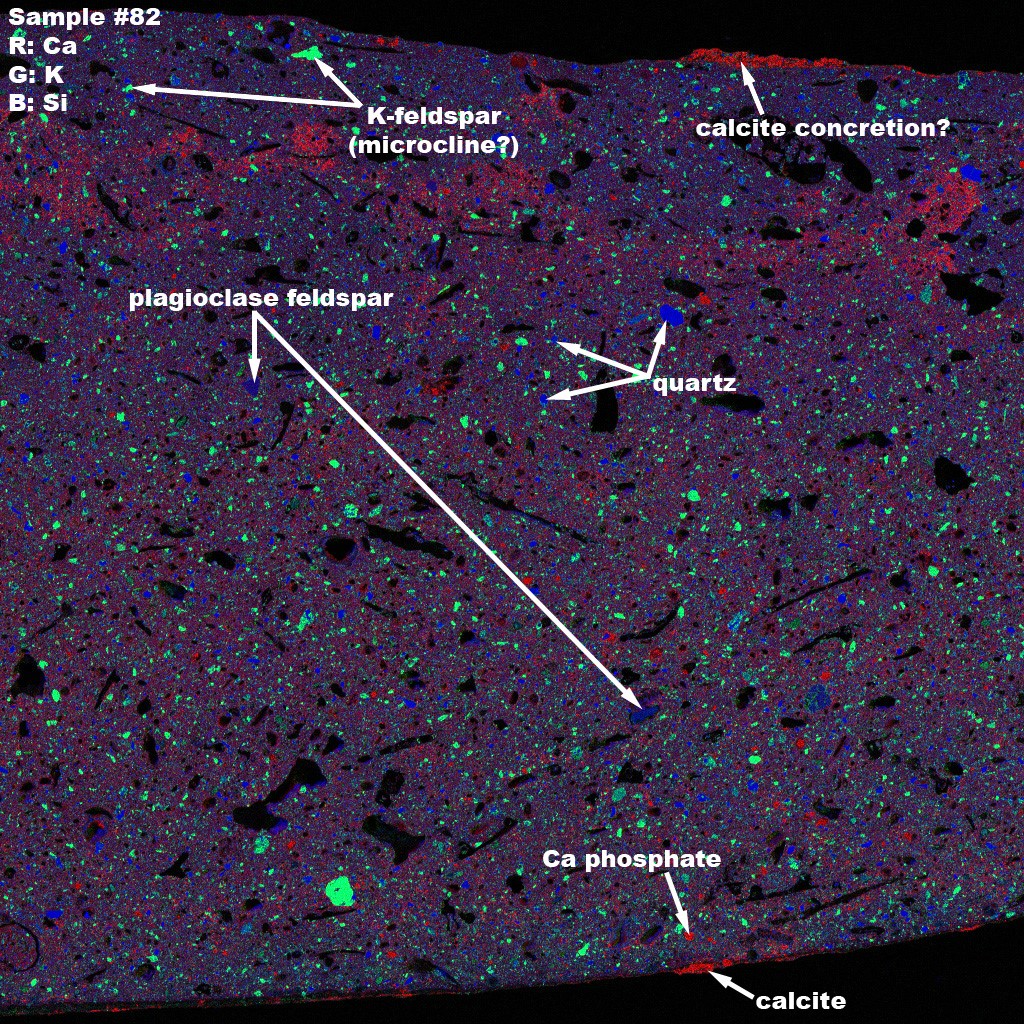
Fig. 13a-2 |
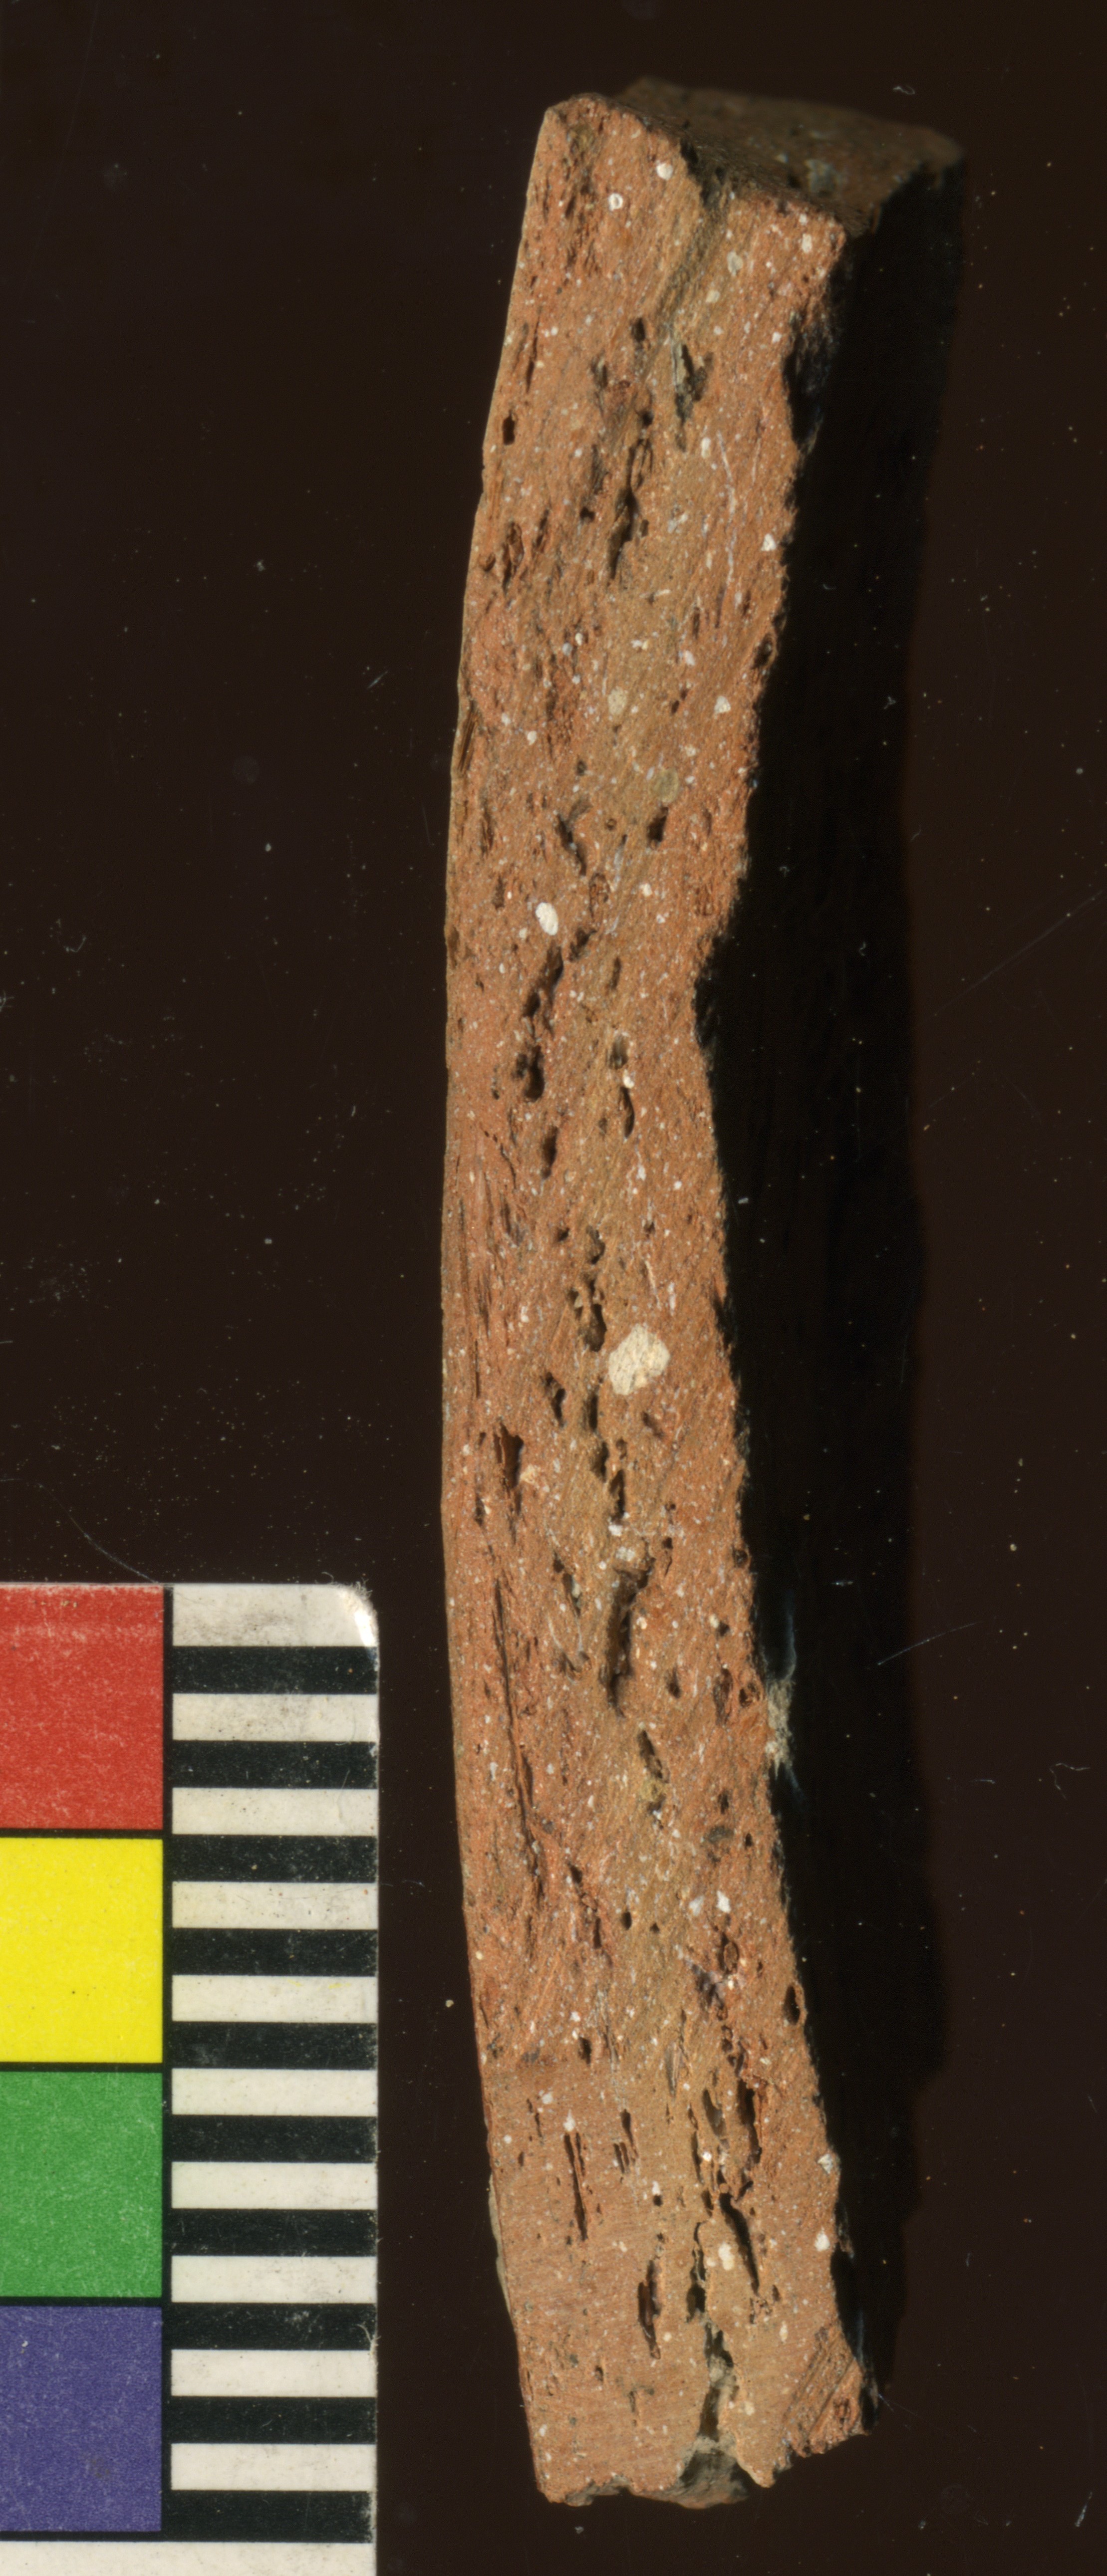
Fig. 13b-1 |

Fig. 13b-2 |
Figure 13: Section images and element maps of Phase 7 wares: (a) Fine Chaff Temper goblet or conical cup?, J4q200p70f89 (photo number V23q4101); (b) Red Orange Calcite Temper open shape?, J3q106p70f63 (photo number V23q4002 (for the latter, see also Figure 11 11). |
Back to top: Colormod
3. Insights into the manufacturing, finishing, and firing processes
Cracks and firing cores (with a characteristic “sandwich effect,” Figures 7, 12) are evidence for varying success in the firing kiln. Electron microscopy and X-ray microanalysis can be fruitfully extended to the examination of slips, paints, and other surface decorations (Figure 14).
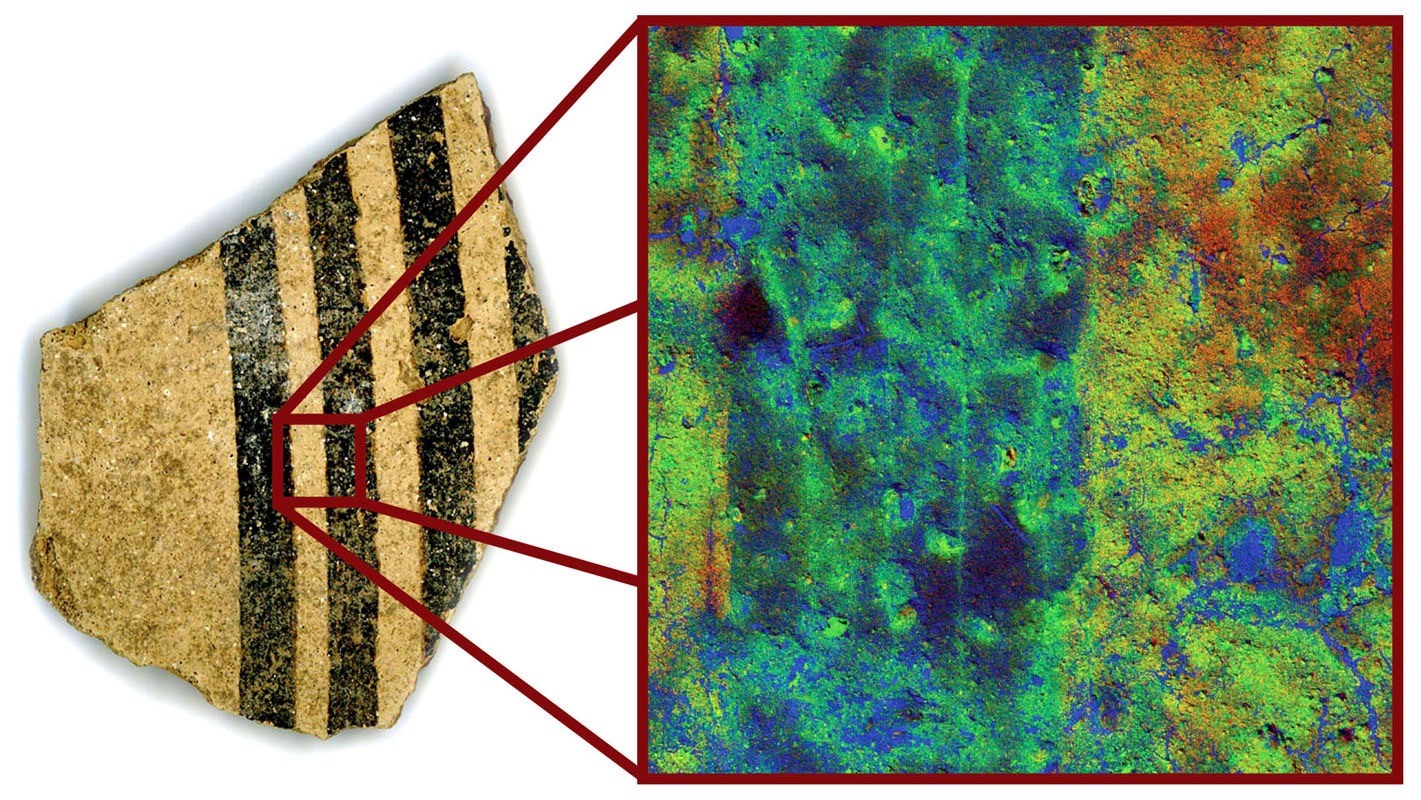
Fig. 14 |
Figure 14: A red-green-blue combination element map shows the compositional differences between the slip and paint on this sherd from a Khabur storage jar. This image also reveals a series of parallel incised lines not apparent to the naked eye (reproduced from Frahm, Nikolaidou, and Kelly-Buccellati 2008, p. 12, fig. 12). |
Back to top: Colormod
4. Understanding the fourth-millennium Late Chalcolithic wares
An important contribution of the X-ray microanalysis regards the examination of Late Chalcolithic ceramics. During the late excavation seasons (2005 onwards) quantities of stratified mid-fourth millennium deposits of sherds and cylinder seal impression were found connected with the temple terrace. The four analyzed samples all came from Unit J1, in front of the revetment wall of the terrace; the they are associated with feature 196, the early (pre-3rd mill.) escarpment at the base of that wall. The sherds belong to the distinctive coarse Chaff Temper ware of the Late Chalcolithic, which features lots of chaff in the clay body and on the surface, a dark and extensive carbon core, and various mineral inclusions, often quite large. (Figure 15). The macroscopic ware descriptions from this period have now been correlated with the microanalysis and element maps, and further informed by the close-up observation of fabrics on section images from the various wares. This has allowed us to build an important database for research into the Late Chalcolithic pottery tradition at the site and throughout the region.
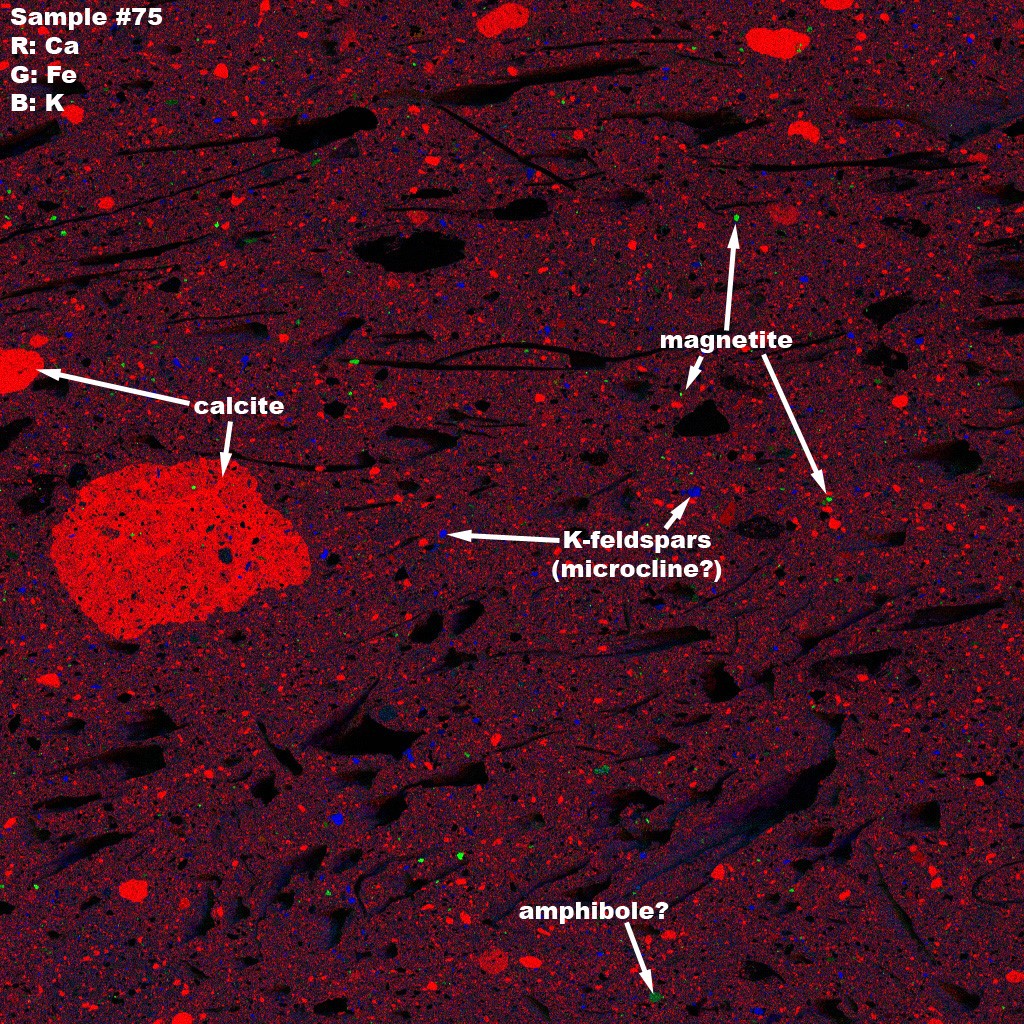
Fig. 15a |
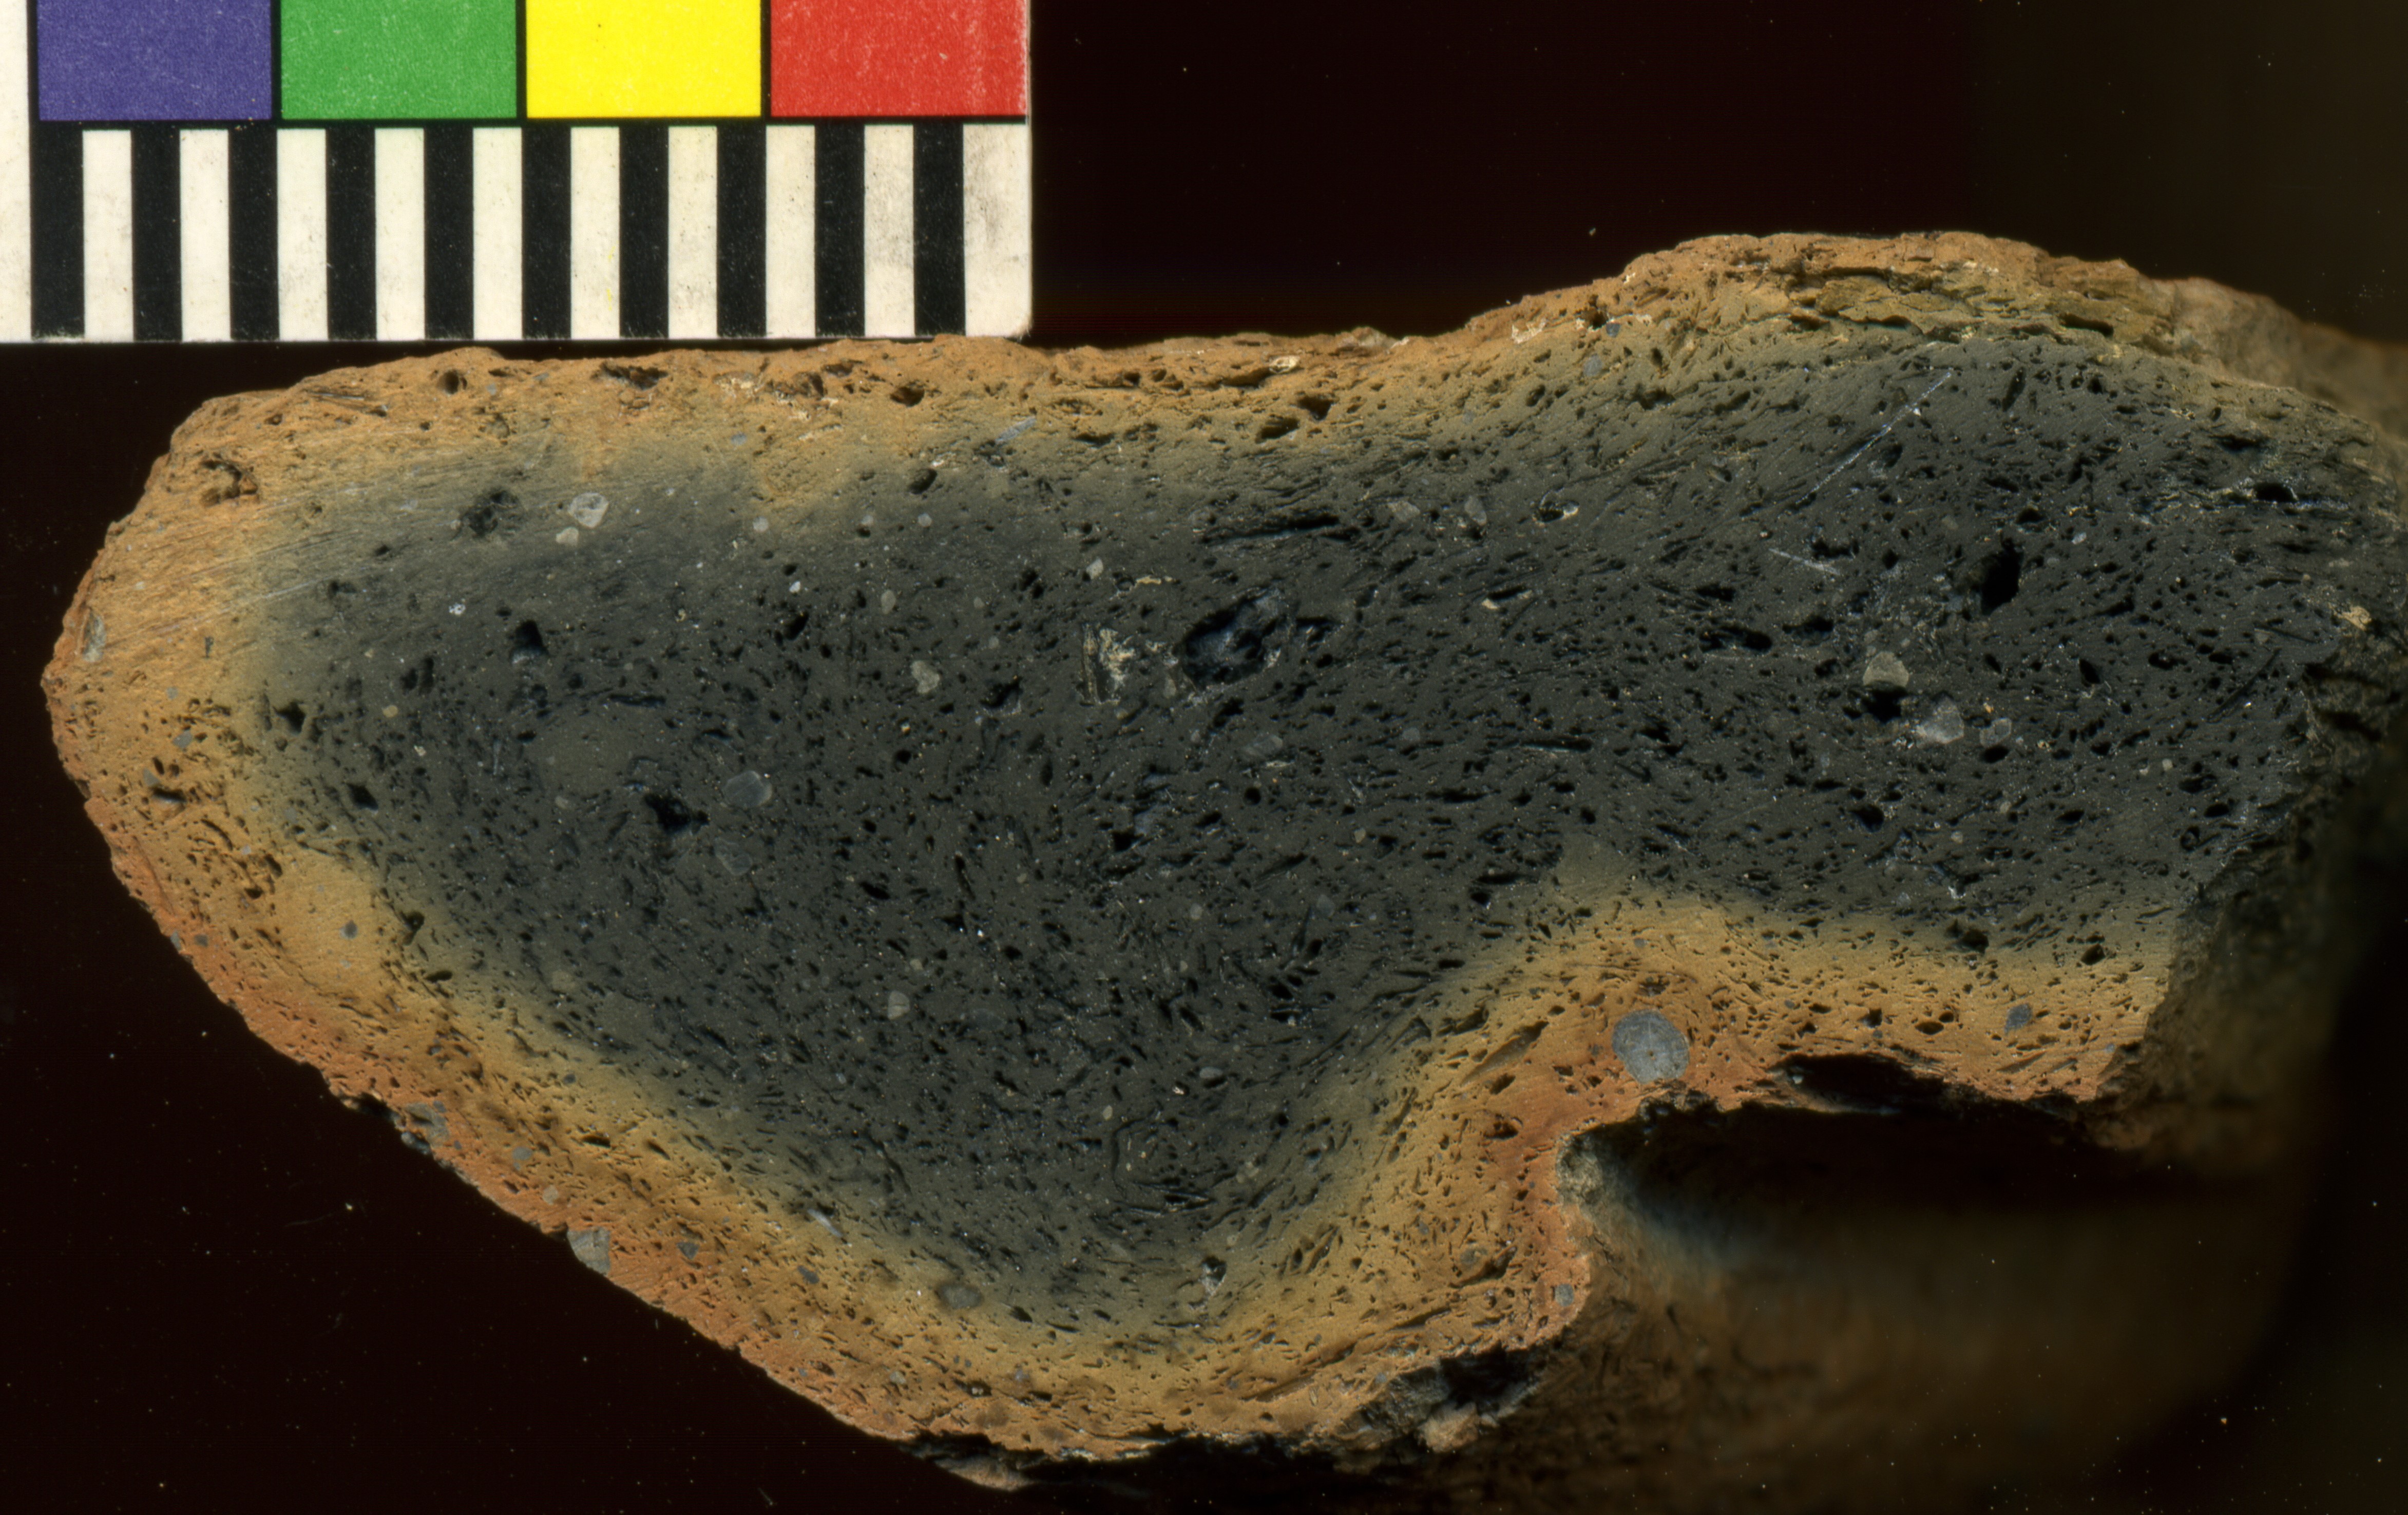
Fig. 15b |
Figure 15: (a) Element map analysis of a Late Chalcolithic Chaff Temper casserole with mineral and organic inclusions, J01q?70f196); (b) section image of a roll-rim jar/bowl in similar fabric, J3q92p2f57 (Photo number V234001); (c) example of Late Chalcolithic casserole (sherd #? context? image?). |
Back to top: Colormod
Progress and viability: The COLORMOD project revisited
Back to top: Colormod
Evaluation
Notwithstanding the early successes of our combined analyses, soon after 2010 we started to realize that the COLORMOD project would not be as viable or far-ranging as we had expected, for reasons both methodological and practical. First, the COLORMOD program was quickly becoming incompatible with the rapidly evolving computer technologies, and increasingly difficult to operate on more modern machines. The software itself was rather cumbersome and time intensive, resulting in a relatively slow-paced analysis. Another problem was that the available data of petrographic and X-ray element analysis – which provided the base for the identification of inclusions that were color-separated and measured by COLORMOD – represented only a fraction of the range covered by the database of sectioned sherds. Consequently, the validity of future calibration between macroscopic analysis and microanalysis would be significantly diminished: without a sizeable and diverse body of laboratory-analyzed data that would serve as the “anchor” of analysis, expanding the application of COLORMOD to more ceramic categories would risk becoming an unreliable and inadequate visual exercise. Analyzing more samples in the laboratory was not an option available in the following years, as the project participants were following different personal and professional paths. Meanwhile, new and sophisticated digital applications were drastically increasing the efficiency and interpretative potential of microscopic fabric analysis, in ways that could not be matched by older methods, let alone macroscopic ones.
In view of these developments, we decided to wrap the COLORMOD project up, while retaining the data and the insights that we have gained in the process. Here we present it as one forward-thinking chapter of experimentation in the long and multi-layered history of archaeological endeavor at Tell Mozan / Ancient Urkesh.
Back to top: Colormod
Digital database
One important component of this project remains valid: the extensive digital database of the high-quality scanned images of sherd sections, together with the substantial body of sectioned sherds, which are kept in the Near Eastern Laboratory of the UCLA Cotsen Institute of Archaeology. Both the digital and the physical collections are excellent reference materials that can be used for further study and for educational purposes, and all the more significant since the actual ceramics library at Mozan is inaccessible under the current political climate in the country. There is broad potential for future research too, either within the original scope of the COLORMOD project or/and along new lines, such as clay sourcing, closer examination of the technological chaîne opératoire, fabric and residue analysis of the pebble-tempered cooking ware (Figure 3c), pigment analysis of painted decorations (see Figure 14), and more. The pottery of the COLORMOD project – a small but meaningful part of the site’s voluminous ceramic corpus – still invites efforts to measure and contextualize the ceramic technologies of ancient Urkesh.
Back to top: Colormod
Notes
- Note 1: Chiari and Cossio 2004. An introduction to the program by Roberto Cossio and Massimo Chiari circulated as a letter in 2003, on file with the Mozan/Urkesh Archaeological Project. Back to text
- Note 2: In 2009, the last field season of the project, no portions of sherds were exported; all sherds remained in the ceramics library at Mozan. Back to text
- Note 3: Several persons participated, in various capacities,at different stages of the project. Hammade Hamza, a member of the Mozan ceramics team, was invaluable during the selection and sampling of sherds. Michael Rauch of the Carnegie Institution of Washington, Marianna Nikolaidou’s husband and a project volunteer, and local crew member Houssein ??? [last name?], carried out the crucial work of cutting, polishing, and scanning the sherds. Hiba Qassar, then an undergraduate at Aleppo [correct?] University, helped with the sherd documentation onsite. And Laerke Recht was instrumental for the UGR integration of the project. We are very grateful to them all. Back to text
- Note 4: On Unit A14, see Kelly-Buccellati 2019. On Unit A15, see the Overview. On Unit A16, see the Overview. Back to text
Back to top: Colormod